Unlock a world of possibilities! Login now and discover the exclusive benefits awaiting you.
- Qlik Community
- :
- Discover
- :
- Blogs
- :
- Product
- :
- Design
- :
- Making QlikView Part of the Story: Embedding Objec...
- Subscribe to RSS Feed
- Mark as New
- Mark as Read
- Bookmark
- Subscribe
- Printer Friendly Page
- Report Inappropriate Content
More and more, blog posts, news articles, and various other online media are incorporating data visualization. A well placed chart or graph can drive home the point of the story being told. While print has been doing this for a long time, unique to the web experience is the arrival of interactive visualizations which allow users to explore and experience the data in a new way.
Not to be left out, there are several options for easily embedding QlikView into websites. While integrating QlikView into the web can be tricky (cross domain scripting, security concerns, etc.) there are some terrific posts on the web by Stefan Walther and Alexander Karlsson (amongst others) describing various ways a person can add some slight code to embed objects into a web page.
Using these same principles, I’ve also developed a tool which should make things as easy as possible for web novices to get QlikView visualizations into their site. Once this tool is implemented, a blog writer who is desperate for some visual aids on their post
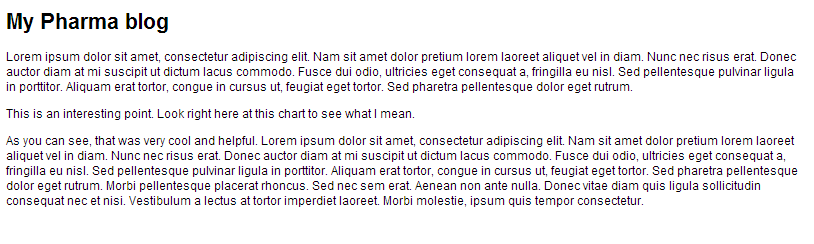
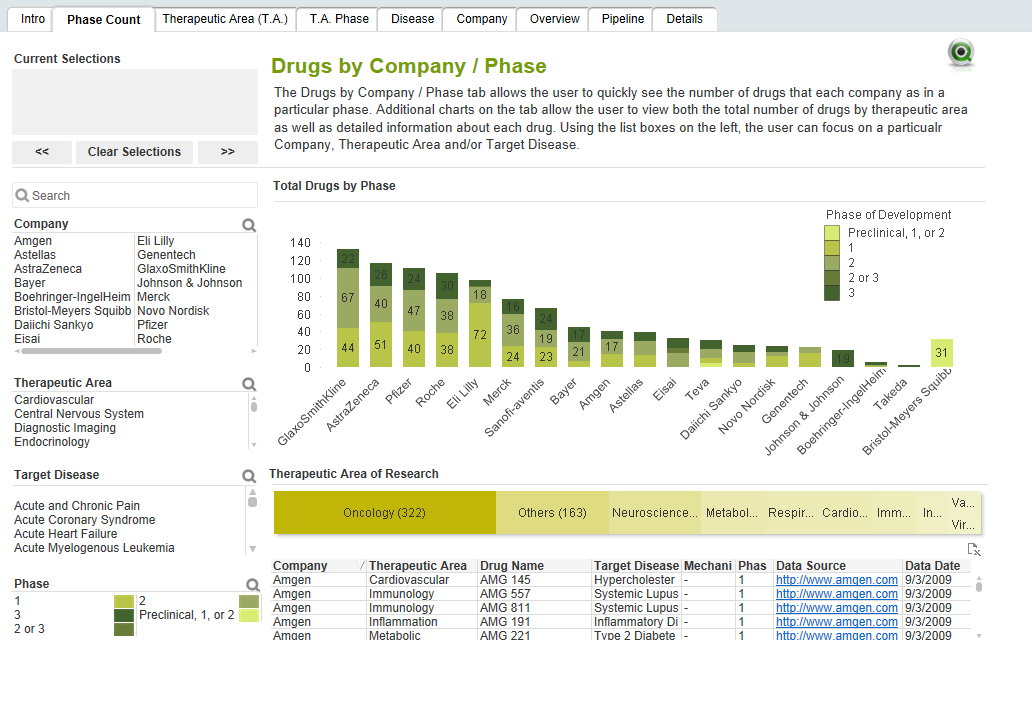
could go to their QlikView app
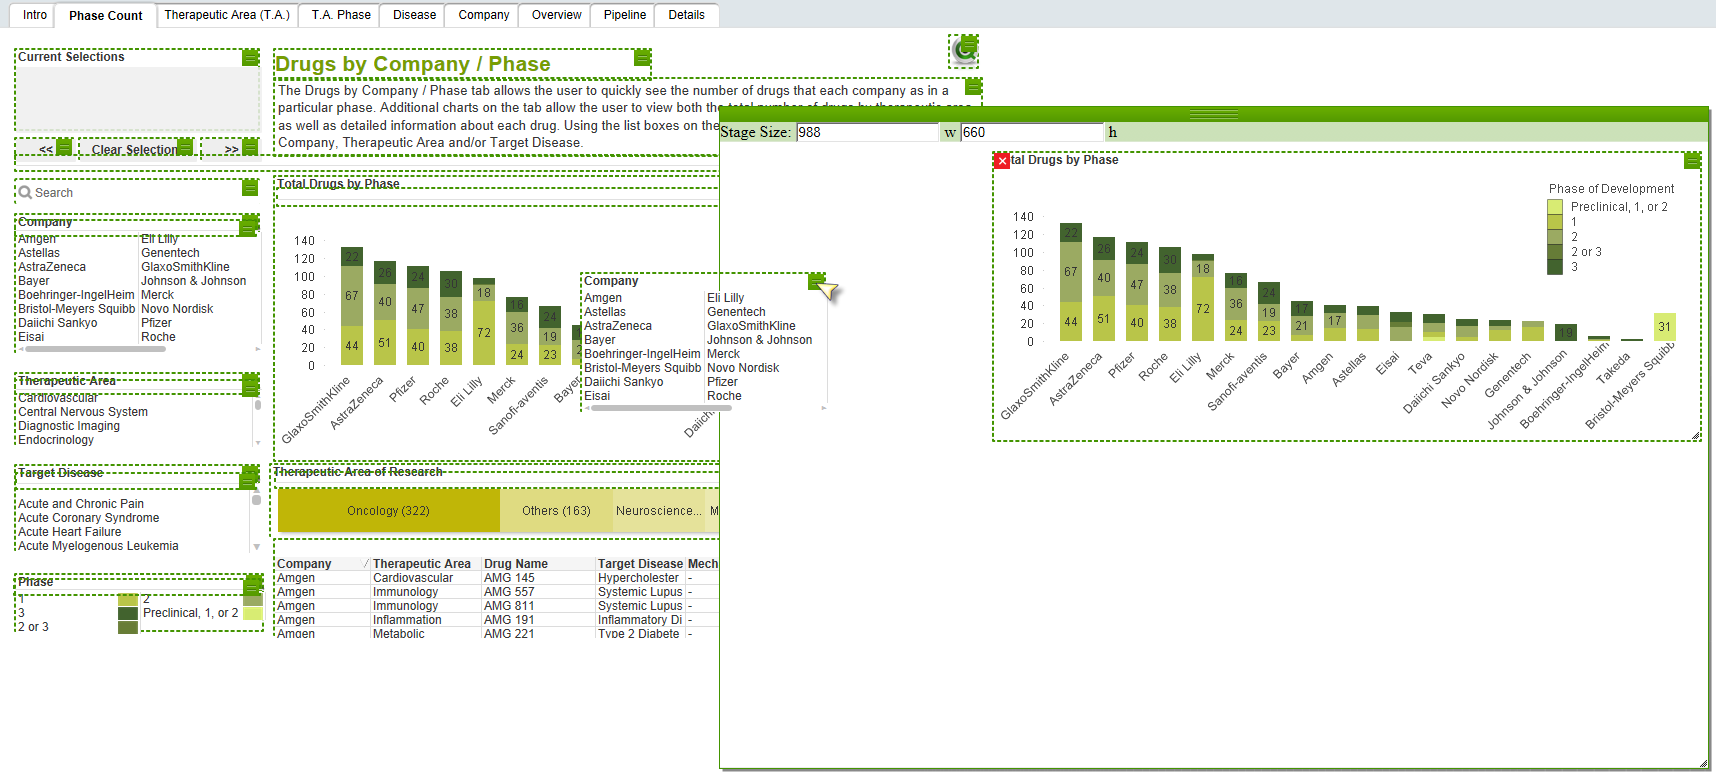
use the tool in an app to add QliKView objects to a staging area where they arrange them how they want
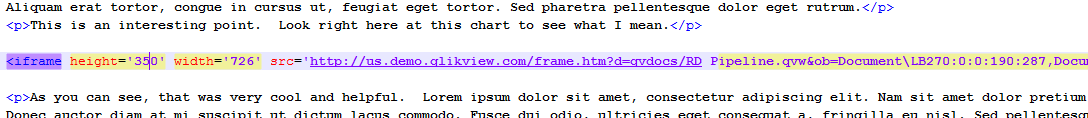
click the “export” button to get the iframe code
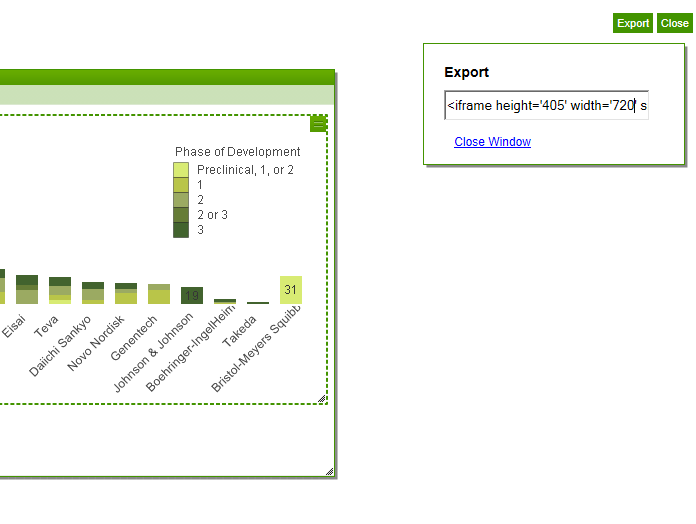
paste the iframe code into the html
and check out the new visualization on your site
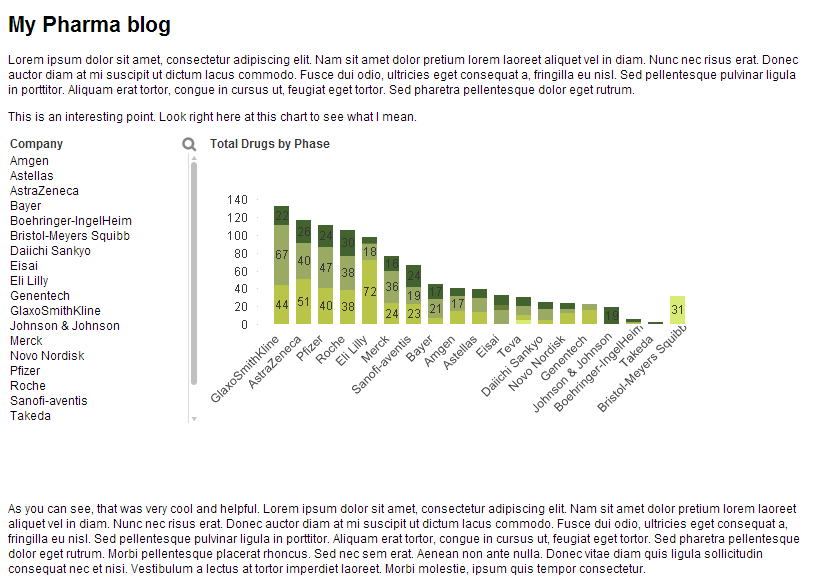
This is very simple for the blogger, and by using iFrames, we are able to avoid cross domain scripting issues and also allow the objects within the frame to communicate with each other, making them interactive.
This solution is an example of how several different types of customizations can be used to create a helpful tool. Click here to download the solution and documentation. To see embedding in action, visit the Image Gallery on the demo site. The “Pinterest-style” image gallery is embedded into the site using these same techniques.
- « Previous
-
- 1
- 2
- Next »
You must be a registered user to add a comment. If you've already registered, sign in. Otherwise, register and sign in.