Unlock a world of possibilities! Login now and discover the exclusive benefits awaiting you.
- Subscribe to RSS Feed
- Mark as New
- Mark as Read
- Bookmark
- Subscribe
- Printer Friendly Page
- Report Inappropriate Content
Since the release of Sense back in September 2014 a lot of good things have happened to the product. If you look back you almost can’t believe that it was just 6 months ago when we launched Sense. Since then, R&D guys and girls have added quite a lot of improvements and new functionality (and more is coming next) into the product.
Today, I don’t want a focus on the company’s centralized development. We talk enough about ourselves here, but on the decentralized Sense development guerrilla from out there. Since January 26 these individuals contributing with a fresh view to Qlik Sense (to QlikView as well) have a place to share their ideas and Open Source projects. It’s called Qlik Branch and it’s open for everyone to join.
From all the projects already submitted to Qlik Branch, I will nominate 3 of my favorites created so far.
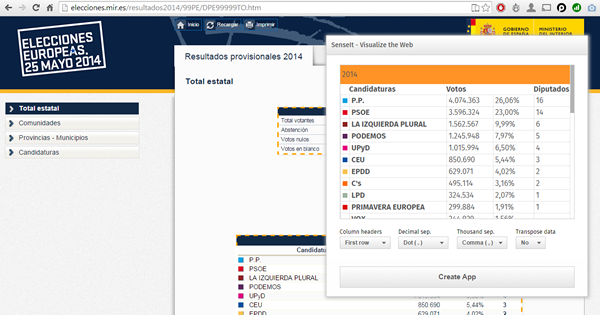
SenseIt by Alex Karlsson
It goes to my personal Top 1 for a variety of reasons but particularly because it opens a completely new and unexplored category for Extensions. We are used to seeing extensions (or visualizations) within the product itself but this is something completely different. SenseIt is a browser extension or plugin that will let you create a new app on the fly by capturing a table from Chrome and loading it as data into your Qlik Sense Desktop. Truly amazing experience and the name is cool too (isn’t it?)
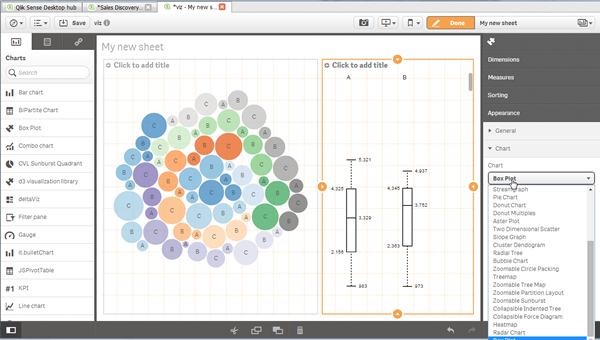
D3 Visualization Library by Speros Kokenes
As a visualization junkie I am, I love D3.js, I truly love some of the beautiful and smart visualizations built around the popular JavaScript library. I have seen (and ported) some of those charts to Sense, one by one, so you end up having a packed chart library on your Sense desktop. Speros have gone a bit further by converting the Visualization object into a truly D3js library where you can go and pick up your favorite D3js visualization, very entertaining. In future releases we might end up having control over the chart colors and some other cool stuff that will make this extension superb, remember you can contribute and make it even better.
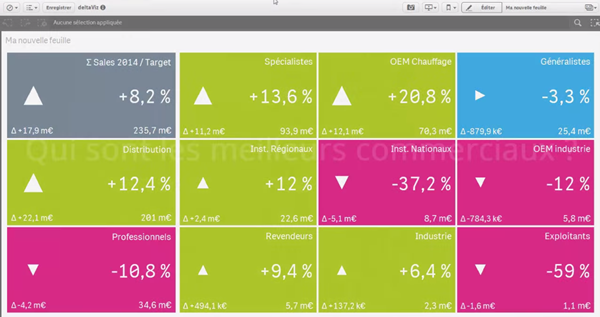
deltaViz self-service dashboard by Yves Blake
For those of us QlikView lovers any addition to the dashboard world in Sense it’s always very much appreciated. If it’s very well executed and designed as it is deltaViz, then there’s no reason to not try it. DetalViz is a complete solution for dashboards focused on comparisons and very well implemented to take advantage of Qlik Sense grid system. If you still have doubts about this visualization, you can see it live here: https://www.youtube.com/watch?v=4s30AEf4qJc
These are my top 3 favorite extensions/visualizations created so far, but what are yours?
AMZ
You must be a registered user to add a comment. If you've already registered, sign in. Otherwise, register and sign in.