Unlock a world of possibilities! Login now and discover the exclusive benefits awaiting you.
- Qlik Community
- :
- All Forums
- :
- QlikView
- :
- Pie Chart - "Others" Issue when 2 expressions are ...
- Subscribe to RSS Feed
- Mark Topic as New
- Mark Topic as Read
- Float this Topic for Current User
- Bookmark
- Subscribe
- Mute
- Printer Friendly Page
- Mark as New
- Bookmark
- Subscribe
- Mute
- Subscribe to RSS Feed
- Permalink
- Report Inappropriate Content
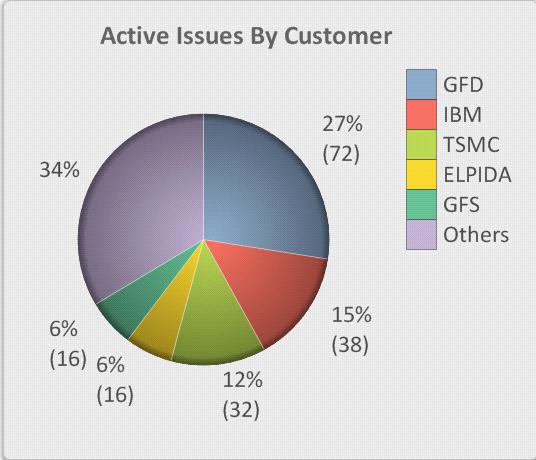
Pie Chart - "Others" Issue when 2 expressions are presented
Hi,
I have a Pie Chart with 2 expressions ( % and Qty )
Both expressions are shown in all customers except for "Others" category which shows only percentage
Attached the QVW file,
Any suggestions?
- Mark as New
- Bookmark
- Subscribe
- Mute
- Subscribe to RSS Feed
- Permalink
- Report Inappropriate Content
Ori Tal,
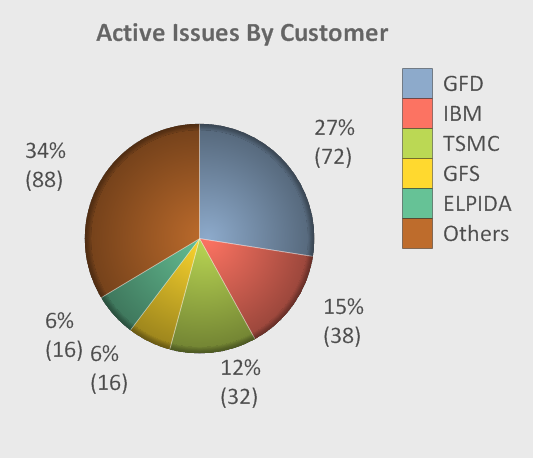
I just opened your app. The pie chart seems to be ok. I am using QV11.
Stefan
- Mark as New
- Bookmark
- Subscribe
- Mute
- Subscribe to RSS Feed
- Permalink
- Report Inappropriate Content
Thanks Stefan, Any idea how to overcome this Issue in QV10 ?
- Mark as New
- Bookmark
- Subscribe
- Mute
- Subscribe to RSS Feed
- Permalink
- Report Inappropriate Content
I can see the issue in QV10, but I have no idea how to solve it (seems like a bug to me). Do you use the latest QV10 release (I currently don't right here)?
What is working is creating an expression group out of the two expressions (drag the second expression on the first in expression tab), then you could switch between the two number formats by clicking the expression group button in the chart. But that is not exactely what you initially requested.
- Mark as New
- Bookmark
- Subscribe
- Mute
- Subscribe to RSS Feed
- Permalink
- Report Inappropriate Content
Thanks for the workarround solution, Since this is a static dashboard with no user interaction abilities
this will not work. Thanks anyway!
- Mark as New
- Bookmark
- Subscribe
- Mute
- Subscribe to RSS Feed
- Permalink
- Report Inappropriate Content
Maybe you can elaborate on something like attached, using a text in chart. You probably need to position the text in chart at a position that is suitable even when the number / percentage of other is changing.
Regards,
Stefan
- Mark as New
- Bookmark
- Subscribe
- Mute
- Subscribe to RSS Feed
- Permalink
- Report Inappropriate Content
Hi Ori,
The Pie chart seems to behave differently in Version 11 and earlier versions.
As you can see that in version 11, we can not drill down on others to see which all are part of others while in earlier versions we could.
And, in earlier versions, Others will only show 1st experssion value at the data point.
So, in your case one possible alternative could be using show numbers in legend so, you can show your 1st expression values with legends and second ones on pie slices (data points).
Just my 2 cents, may be Stefan can suggest some better alternatives. 
...
Regards
Ashutosh
- Mark as New
- Bookmark
- Subscribe
- Mute
- Subscribe to RSS Feed
- Permalink
- Report Inappropriate Content
Hi Stefan,
Your attachment seem to work but im not sure how.
Please explain what exactly did you do to make it work?
- Mark as New
- Bookmark
- Subscribe
- Mute
- Subscribe to RSS Feed
- Permalink
- Report Inappropriate Content
Please go to presentation tab - Text in chart. I used a text expression like
=if(count(distinct TS_COMPANIES_NAME)>5,
'('&count({<TS_COMPANIES_NAME = {"=num(rank(count(TS_ISSUEID),4))>5"}>} TS_ISSUEID)&')','')
The magical number '5' is indicating your maximum number of slices (maybe it its better to use a variable here and in the maximum number of slices field of presentation tab).
Then I used CTRL-Shift togehter with the mouse to move the text in chart at its position (as said, if the numbers / size of slices change, this might need to be adjusted or a one-fits-all position needs to be found).
I also tried Ashutosh's alternative, but then I ran into:
http://community.qlik.com/message/189847
Hope this helps,
Stefan