Unlock a world of possibilities! Login now and discover the exclusive benefits awaiting you.
- Qlik Community
- :
- All Forums
- :
- QlikView App Dev
- :
- Re: Stacked Bar Chart
- Subscribe to RSS Feed
- Mark Topic as New
- Mark Topic as Read
- Float this Topic for Current User
- Bookmark
- Subscribe
- Mute
- Printer Friendly Page
- Mark as New
- Bookmark
- Subscribe
- Mute
- Subscribe to RSS Feed
- Permalink
- Report Inappropriate Content
Stacked Bar Chart
Hi All,
We are working under Qlikview 9.0. system. I am trying to develop a stacked bar chart. I have one dimension (i.e. YYYYMM) and 30 expressions where i have to create 2 stacked bar chart for each YYYYMM where in 15 expressions are combined to develop one stack and other 15 expressions to create seond stack chart.
I tried a lot but was successful to create only 1 stack considering all 30 expressions for each YYYYMM dimension but not 2 stack bar each with 15 expressions for each YYYYMM.
Can somebody please guide me to achieve what i require.
Thanks.
Jigesh
- Mark as New
- Bookmark
- Subscribe
- Mute
- Subscribe to RSS Feed
- Permalink
- Report Inappropriate Content
Hi,
you can use the function Valuelist(), see my example!
Greetings from Munich
Martina
- Mark as New
- Bookmark
- Subscribe
- Mute
- Subscribe to RSS Feed
- Permalink
- Report Inappropriate Content
HI Martina,
THe graph plotted is the same as i want but i hav a fixed dimension called YYYYMM .
IF you can please help me with this.
Sorry for late reply.
THanks for your prompt ans.
Jigesh
- Mark as New
- Bookmark
- Subscribe
- Mute
- Subscribe to RSS Feed
- Permalink
- Report Inappropriate Content
Hi Jigesh,
look at my example again and a nice day
Greetings from Munich
Martina
- Mark as New
- Bookmark
- Subscribe
- Mute
- Subscribe to RSS Feed
- Permalink
- Report Inappropriate Content
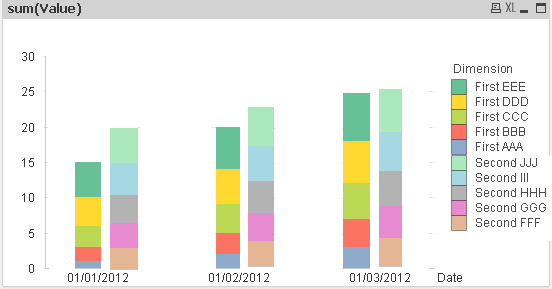
I think what Jigesh wants is something like that:
- Mark as New
- Bookmark
- Subscribe
- Mute
- Subscribe to RSS Feed
- Permalink
- Report Inappropriate Content
Hi Nicolas,
SOrry for late reply; way too busy at office. The image shown is what i want but in my case i have nly one dimension YYYYMM and multiple expressions...
Still working around for solution as the director of my company is very fond of stacked bar personally so what trying my best to get it worked but no luck yet...if anyone can please help me out....would b great
Thanks Nicolas.
Regards,
Jigesh
- Mark as New
- Bookmark
- Subscribe
- Mute
- Subscribe to RSS Feed
- Permalink
- Report Inappropriate Content
Hi Jignesh
- In your load script, load the entire data twice.
- Create a flag field in the load script and assign it values 1 and 2 (or anything else but 2 distinct values), one for each of the load script bits.
- Add flag field as second dimension to your bar chart and suppress the dimension from display.
- Then write your expressions. Enclose the expressions you want in the first stack inside if(flag=1,<expr>,0) and the ones in the second stack inside if(flag=2,<expr>).
This should work. If not, please share a small sample of your qvw (with data sample in case of external load) so that we can use your data itself while resolving your issue.
Regards
Sid