Unlock a world of possibilities! Login now and discover the exclusive benefits awaiting you.
- Qlik Community
- :
- All Forums
- :
- QlikView App Dev
- :
- Re: Two dimension graph with bar and line
- Subscribe to RSS Feed
- Mark Topic as New
- Mark Topic as Read
- Float this Topic for Current User
- Bookmark
- Subscribe
- Mute
- Printer Friendly Page
- Mark as New
- Bookmark
- Subscribe
- Mute
- Subscribe to RSS Feed
- Permalink
- Report Inappropriate Content
Two dimension graph with bar and line
Hello,
I have attached a project with simple example of the imput data and some not correct graphs.
I have a table with two dimensions and two values. I would like to show the graph with those two dimmensions (like graph 'Two values') where one value will be shown as stacked bars (graph 'Correct Bars') and the second one will be shown as line with sum over all dimensions.
When I simply add two expressions 'sum(Data_A)' and 'sum(Data_B)', it is showing bars grouped, not stacked and the line contains all values from second dimension at 'one vertical line' for each value from first dimmension. I want sum instead of those values for line. But it still necessary to be able to select just one or several values from second dimmension and both line and bars need to show correct values. So the second table with sum od 'Data_B' grouped by first dimmension will not help as this value will not change when just one value from 'Data_B' is selected.
Anybody can help me with this, please?
I hope that the description is understandable.
Regards,
Jindra
- Mark as New
- Bookmark
- Subscribe
- Mute
- Subscribe to RSS Feed
- Permalink
- Report Inappropriate Content
There is no way to do this easily. Basically you want to stack the first expression using both dimensions. But the second expression should not be stacked on the first and, further, the second expression should not use the second dimension at all. There is (unfortunately) no way to tell QlikView to do this.
However if you hard code the values of the second dimension in the expressions, you can create it:
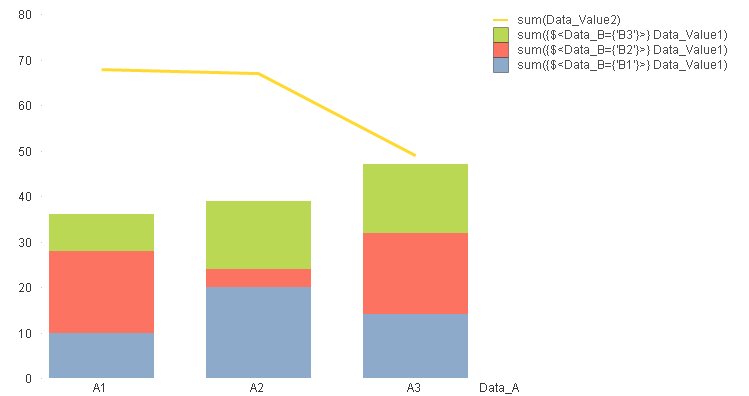
This is a stacked combo chart with one dimension and four expressions. If you set an expression to "line", it will not stack up on the bars. Good luck!
HIC
- Mark as New
- Bookmark
- Subscribe
- Mute
- Subscribe to RSS Feed
- Permalink
- Report Inappropriate Content
Thank you Henric.
I was able to get to this point too. The problem is that the number of different values in second dimmension can change on the customer site and I don't want to change the graph each time they do it.
So is the only way how to do it via some VB script which will dynamically add Expressions to the graph based on the nuber of different values at the time of reload?
J.
- Mark as New
- Bookmark
- Subscribe
- Mute
- Subscribe to RSS Feed
- Permalink
- Report Inappropriate Content
Since I am allergic to macros  I cannot recommend any VB script...
I would instead define the necessary expressions and leave them there. The chart will work anyway. In the chart below I have added expressions for not-yet-existing values:
HIC

- Mark as New
- Bookmark
- Subscribe
- Mute
- Subscribe to RSS Feed
- Permalink
- Report Inappropriate Content
I can understand that 
Unfortunatelly there can be literally any value in the dimmension as it is free text so we are not able to go this way. But it is a good idea anyway.
Can I ask you why are you hate that macros? I don't like VB so I will gladly avoid it but this time it seems to me that it is only option. Is there any chance that the macro will cause some problem to the projetc - very slow loading, not stable run, ...?
J.
- Mark as New
- Bookmark
- Subscribe
- Mute
- Subscribe to RSS Feed
- Permalink
- Report Inappropriate Content
You can of course try to solve it with a macro, and you will probably succeed - as long as you work with QlikView Desktop. But when you post your app on a server, you will encounter problems. First of all, most macros run client-side, which means that they will not run at all if you use the thin (Ajax) client. Secondly, as one of many users on a server, you will not have the rights to modify a chart. So, I am not sure macros are a good solution...
HIC