Unlock a world of possibilities! Login now and discover the exclusive benefits awaiting you.
- Qlik Community
- :
- All Forums
- :
- QlikView Integrations
- :
- Re: Google Maps - Heatmap
- Subscribe to RSS Feed
- Mark Topic as New
- Mark Topic as Read
- Float this Topic for Current User
- Bookmark
- Subscribe
- Mute
- Printer Friendly Page
- Mark as New
- Bookmark
- Subscribe
- Mute
- Subscribe to RSS Feed
- Permalink
- Report Inappropriate Content
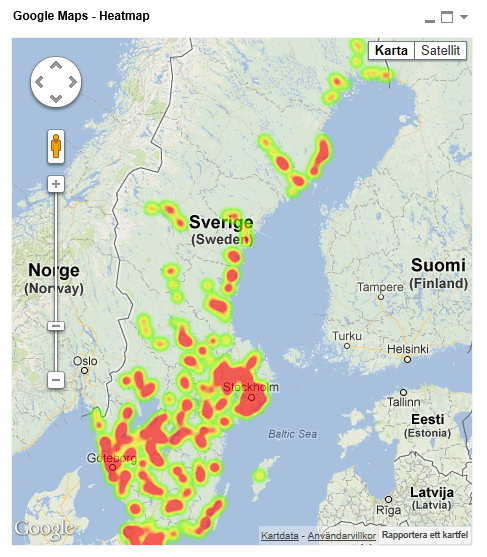
Google Maps - Heatmap
Google Maps Extension with Heatmap support.
QlikTech takes no responsibility for any code and QlikTech Support Agreement does not cover issues with this extension.
Please review Googles license agreement before you put this into production.
Big thanks to pablolabbe for contributing to the project.
Download
mindspank/GoogleMaps-Heatmap-QV11 · GitHub
Introduction
A new addition to the Google Maps family. This extensions will take your data points and produce a heatmap on top of a Google Map.
A good tool easily spot areas with higher intensity of data points. There is no selection support for this extension has there is no markers available at the moment.
You can either use the extension 'as is' or use it as a base to further customize it to fit your needs.
2013-12-14
Finally tracked down the errors when you tried to pass in faulty data.
Less DOM-calls.
2013-06-04
Added a check that QV passes valid data points to Google. If you are passing an invalid data point it will log it to the console in your browser.
Also enabled weighted data points. Now the weight if your data point in the heatmap will correspond to your expression value. If you want equal weight between the points, e.g the original heatmap where the number of data points determined your heat level, set a arbitrary value of =1
If you build something awesome please share it with the community!
Live long and prosper.
- Mark as New
- Bookmark
- Subscribe
- Mute
- Subscribe to RSS Feed
- Permalink
- Report Inappropriate Content
Thanks for the extention, we've implemented it with UK postcodes (long/lat) and is showing nicely, but when we try and use an expression of '=sum(value)' we recieve a message of 'Unable to get value of property 'NaN': Object is null or undefined.
Any ideas?
- Mark as New
- Bookmark
- Subscribe
- Mute
- Subscribe to RSS Feed
- Permalink
- Report Inappropriate Content
Try to set up the same dimensions and expression in a normal straight table and see if you get any strange results. Google is quite sensitive of the data you pass to them. And for heatmaps the expression doesn't really have use besides to filter your dimension values.
Kind Regards
Alexander Karlsson
31 maj 2013 kl. 14:12 skrev "seb_mann" <qcwebmaster@qlik.com<mailto:qcwebmaster@qlik.com>>:
QlikCommunity<http://community.qlik.com/index.jspa>
Re: Google Maps - Heatmap
created by seb_mann<http://community.qlik.com/people/seb_mann> in Integration and Extensions - View the full discussion<http://community.qlik.com/message/352232#352232>
- Mark as New
- Bookmark
- Subscribe
- Mute
- Subscribe to RSS Feed
- Permalink
- Report Inappropriate Content
Thanks for the quick response, the straight table looks fine, nothing out of the ordinary is obvious.
We were hoping to be able to get the 'heat' to reresent the sum of value for that area, is this even possible before we pursue this?
- Mark as New
- Bookmark
- Subscribe
- Mute
- Subscribe to RSS Feed
- Permalink
- Report Inappropriate Content
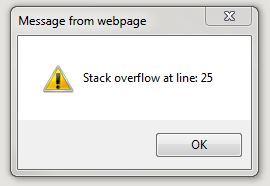
Has anyone had any issue with having too many inputs for Lat and Long? When my data is filtered a bit, it works great, but as soon as the filters are cleared I get the following error:
- Mark as New
- Bookmark
- Subscribe
- Mute
- Subscribe to RSS Feed
- Permalink
- Report Inappropriate Content
The HeatMap will get a stack overflow: 25 if you have any data points that are null.
Since the expression really doesn't work anyway, just use something simple like SUM(Latitude) to limit your data points to real values.
BTW, it would be great if we could actually indicate the heat with something like SUM(Value). It looks like this one works purely on the density of the data points (my guess?)
- Mark as New
- Bookmark
- Subscribe
- Mute
- Subscribe to RSS Feed
- Permalink
- Report Inappropriate Content
Yeah currently it's only based on the density of the data points. I'll check if I can't add the expression value as a weight to the data point also.
For the stack overflow errors, 99% of the time it's because junk data is being passed to Google. I could add some checks in the script to check that every row is valid, it would impact the performance of course by a couple of milliseconds but perhaps it is worth it. Or just make sure the data model does not contain junk 
- Mark as New
- Bookmark
- Subscribe
- Mute
- Subscribe to RSS Feed
- Permalink
- Report Inappropriate Content
Same for me too. And there insn't any junk on data model.
Stack overflow at line: 25 ( Português - Estouro de pilha linha: 25)
- Mark as New
- Bookmark
- Subscribe
- Mute
- Subscribe to RSS Feed
- Permalink
- Report Inappropriate Content
Uploaded a new version to the orginal post that checks if you are trying to pass an invalid data point to google and logs it to the console if that's the case.
Test it out and see if it works or not.
- Mark as New
- Bookmark
- Subscribe
- Mute
- Subscribe to RSS Feed
- Permalink
- Report Inappropriate Content
Hey Aaron,
Your wish is my command, the expression value will now control the heat level for each data point.
It's on a linear scale so you might want to normalize your values some what. If you still want the heat level to correspond with your data points then set a normal =1 for your expression.
I updated the orginal post so you can download that extension and replace the old one.
- Mark as New
- Bookmark
- Subscribe
- Mute
- Subscribe to RSS Feed
- Permalink
- Report Inappropriate Content
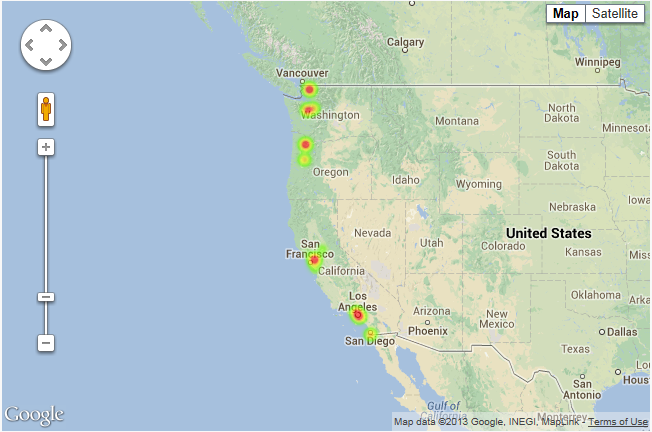
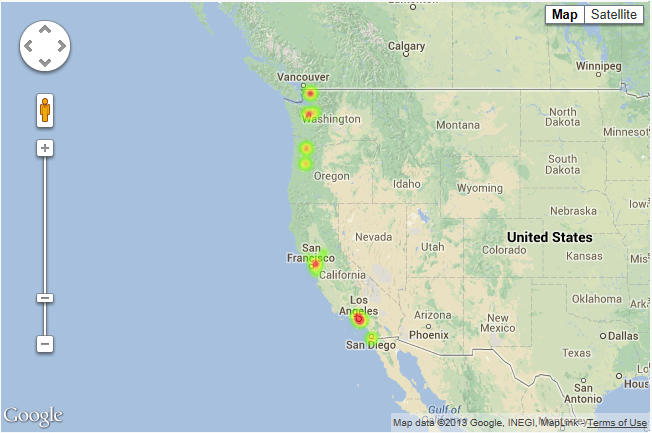
Alex,
So I tried the latest version. Given my small data set, the difference is quite subtle. But with a larger, less distributed set I am sure we could all see where having a true evaluated expression would be more correct and therefore more usable in most situations. I still had to use a flag for my populated coordinate rows and a set to overcome issues in rendering:
SUM({<GeoExistFlag={1}>}ExtendedAmount)
Here is a before and after; I know not much difference with this data set...
I didn't expect you to drop everything and get this done. You are an amazing contributor!