Unlock a world of possibilities! Login now and discover the exclusive benefits awaiting you.
- Qlik Community
- :
- All Forums
- :
- QlikView App Dev
- :
- Re: Full Timeline
- Subscribe to RSS Feed
- Mark Topic as New
- Mark Topic as Read
- Float this Topic for Current User
- Bookmark
- Subscribe
- Mute
- Printer Friendly Page
- Mark as New
- Bookmark
- Subscribe
- Mute
- Subscribe to RSS Feed
- Permalink
- Report Inappropriate Content
Full Timeline
Hello,
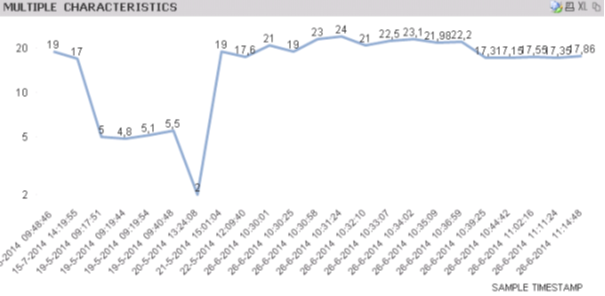
I have problem with visualization transactions in a line chart. These transactions (sample measurements) are from May / June.
Basis QV will show the line at this way.
But what I want is that the transactions will be shown within a full period (per example a full year) even when there are no transactions. So I can see trending in time. Basic graph options like 'suppress when zero' is no solution. I assume that the solution lays in scripting
Anybody idea's, examples or experience?
Best regards,
Robert
- Mark as New
- Bookmark
- Subscribe
- Mute
- Subscribe to RSS Feed
- Permalink
- Report Inappropriate Content
do you have a master calendar which contains all Dates?
then use that calendar and select "Show all values" in the Dimension tab and
untick "donot supress null values" on the presentation tab
Does that helps?
- Mark as New
- Bookmark
- Subscribe
- Mute
- Subscribe to RSS Feed
- Permalink
- Report Inappropriate Content
Hi Robert, your dimension must have all the values in the table even though the expression value is zero.
You need unselect, "Suppress Zero values " option on the Presentation tab and select the "Show all values" option on the Dimension tab.
Please provide the sample data if you still have the questions.
- Mark as New
- Bookmark
- Subscribe
- Mute
- Subscribe to RSS Feed
- Permalink
- Report Inappropriate Content
Hi Rudolf,
Thanks for you fast reply.
No I do not have a Calendar of all dates. That’s the direction which I was looking for.
Can you be more specific? A scripting example perhaps?
Robert
Robert Waterval
ICT
Koninklijke Mosa bv
Meerssenerweg 358
P.O. Box 1026
NL-6201 BA Maastricht
T +31 (0)43 368 8803
F +31 (0)43 363 11 77
robert.waterval@mosa.nl
www.mosa.nl<http://www.mosa.nl/>
<http://www.facebook.com/mosatiles> <http://www.linkedin.com/company/royal-mosa>
Van: Rudolf Linder
Verzonden: vrijdag 29 augustus 2014 15:33
Aan: Robert Waterval
Onderwerp: Re: - Full Timeline
Qlik Community<http://community.qlik.com/>
Full Timeline
reply from Rudolf Linder<http://community.qlik.com/people/HRLinder?et=watches.email.thread> in Scripting - View the full discussion<http://community.qlik.com/message/598016?et=watches.email.thread#598016>
- Mark as New
- Bookmark
- Subscribe
- Mute
- Subscribe to RSS Feed
- Permalink
- Report Inappropriate Content
you should start with an autogenerated calender
Let vMindate=num(date('01-01.2014')
Calendar:
load $(vMindate) + rowno()-1 as DateNumber,
date($(vMindate)+rowno()-1) as Yourdate
autogenerate 365;
Then you Need to connect the calendar with your facttable;
Ideally your date field is named Yourdate.
You can enhance the calendar with months, weeks, quarters etc.
which will provide one full year calendar for 2014. There are surely more docu about creating mastercalender herein.
- Mark as New
- Bookmark
- Subscribe
- Mute
- Subscribe to RSS Feed
- Permalink
- Report Inappropriate Content
Thnks,
Works fine!
Reagrds,
Robert
Robert Waterval
ICT
Koninklijke Mosa bv
Meerssenerweg 358
P.O. Box 1026
NL-6201 BA Maastricht
T +31 (0)43 368 8803
F +31 (0)43 363 11 77
robert.waterval@mosa.nl
www.mosa.nl<http://www.mosa.nl/>
<http://www.facebook.com/mosatiles> <http://www.linkedin.com/company/royal-mosa>
Van: Rudolf Linder
Verzonden: vrijdag 29 augustus 2014 15:51
Aan: Robert Waterval
Onderwerp: Re: - Full Timeline
Qlik Community<http://community.qlik.com/>
Full Timeline
reply from Rudolf Linder<http://community.qlik.com/people/HRLinder?et=watches.email.thread> in Scripting - View the full discussion<http://community.qlik.com/message/598020?et=watches.email.thread#598020>