Unlock a world of possibilities! Login now and discover the exclusive benefits awaiting you.
- Qlik Community
- :
- All Forums
- :
- QlikView App Dev
- :
- X Axis formatting for Time
- Subscribe to RSS Feed
- Mark Topic as New
- Mark Topic as Read
- Float this Topic for Current User
- Bookmark
- Subscribe
- Mute
- Printer Friendly Page
- Mark as New
- Bookmark
- Subscribe
- Mute
- Subscribe to RSS Feed
- Permalink
- Report Inappropriate Content
X Axis formatting for Time
Hi All,
Im using QlikVIew to analyse data logs, so changing their format isnt possible which i think is leading to my issue.
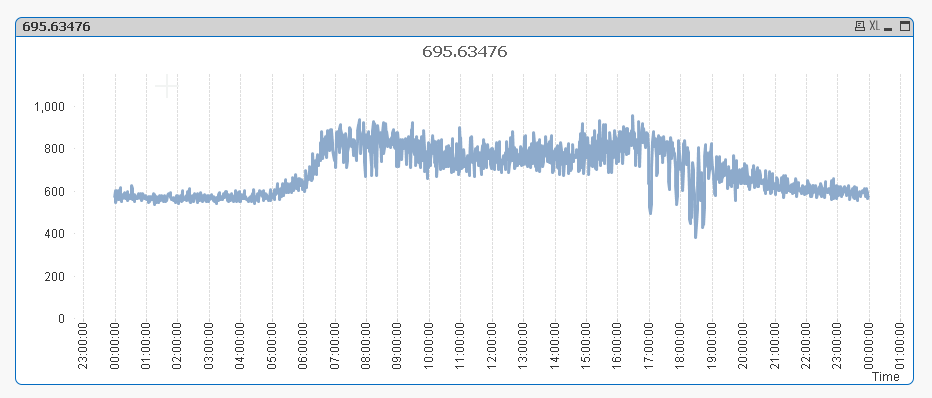
on the X axis I have Time and on the Y some average function (Doesnt matter yet).
What Im after on the X axis is show time thats all, when I click the continuous option QlikView seems to convert the time to a fraction of a day which isnt really very good, ideally it would show every hour but when i zoom in shows minutes or something along them lines.
I have attached the file so you can have a play and see where im coming from.
thanks
- Tags:
- new_to_qlikview
- Mark as New
- Bookmark
- Subscribe
- Mute
- Subscribe to RSS Feed
- Permalink
- Report Inappropriate Content
try formatting in tab number the continous x-axis as time with format hh:mm:ss
then in axis tab, set label vertical
hope it helps
- Mark as New
- Bookmark
- Subscribe
- Mute
- Subscribe to RSS Feed
- Permalink
- Report Inappropriate Content
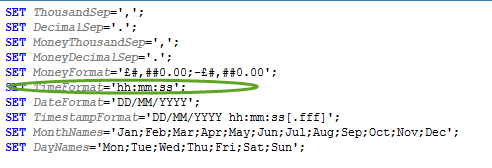
If you want to get the format 'hh:mm'. Go to Edit script and change time format to 'hh:mm'. Attached is the place where you can change it from 'hh:mm:ss' to 'hh:mm'. Hope this helps.
Suraj
- Mark as New
- Bookmark
- Subscribe
- Mute
- Subscribe to RSS Feed
- Permalink
- Report Inappropriate Content
I am creating a stacked combo chart with a continuous X axis, but I am having trouble with the data representation. When I see the full char the dates are correctly formatted:

I am used the following in the load script:
LOAD
CallCenterCount,
DATE(CallCenterDate,'MM/DD/YYYY') AS [CallCenterDate],
CallCenterMonthNum,
CallCenterType,
CallCenterYear;
However, when I zoom in on one date in the chart, the information changes to being formatted a number:

I have tried several things, but I have been unsuccessful in trying to keep the date formatted as MM/DD/YYYY. Any help would be great!