Unlock a world of possibilities! Login now and discover the exclusive benefits awaiting you.
- Qlik Community
- :
- All Forums
- :
- QlikView Integrations
- :
- Loading data in Array
- Subscribe to RSS Feed
- Mark Topic as New
- Mark Topic as Read
- Float this Topic for Current User
- Bookmark
- Subscribe
- Mute
- Printer Friendly Page
- Mark as New
- Bookmark
- Subscribe
- Mute
- Subscribe to RSS Feed
- Permalink
- Report Inappropriate Content
Loading data in Array
Hello all,
I'm working on an extension based on Morris.js.
It has to loop through the data and put all values of txt_dimension/txt_expression in an Array.
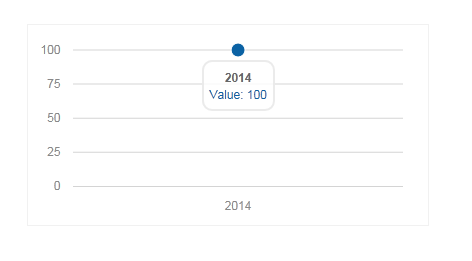
I tried some things (see code beneath) but with this solution it only gives the selected value or when nothing
is selected the last value of an record in the line-chart
for(var rowIx = 0; rowIx < td.Rows.length; rowIx++) {
            var row = td.Rows[rowIx];

            var txt_dimension = row[0].text;
            var txt_expression = row[1].text;

        }
The function of the line-chart where I call my variables.
$(function() {
            new Morris.Line({
              element: 'line-chart',
              data:[{year: txt_dimension, value:txt_expression}],
              xkey: 'year',
              ykeys: ['value'],
              labels: ['Value']
            });
        });
If I use the example and fill in the Array like the code beneath it works fine but I wan't it to be generated with my own data.
  data: [
    { year: '2010', value: 100 },
    { year: '2011', value: 120 },
{ year: '2012', value: 90 }
  ],
screenshot of the value that is given:
Hopefully someone has an answer to get this working?
Greets,
Victa
Accepted Solutions
- Mark as New
- Bookmark
- Subscribe
- Mute
- Subscribe to RSS Feed
- Permalink
- Report Inappropriate Content
Hey,
So your loop aren't really doing anything, for every iteration you replace the value of your variables with the data for each iteration.
Try something like this instead
var qvdata = [];
for(var rowIx = 0; rowIx < td.Rows.length; rowIx++) {
var row = td.Rows[rowIx];
var obj = {
year: row[0].text,
value: row[1].text
};
qvdata.push(obj);
}
Then pass in the qvdata variable to the morris data property.
- Mark as New
- Bookmark
- Subscribe
- Mute
- Subscribe to RSS Feed
- Permalink
- Report Inappropriate Content
Morris.js seems nice.
If you get the extension working and decide to share it, feel free to post a reference to it here on the forum.
Would love to try it out myself!
- Mark as New
- Bookmark
- Subscribe
- Mute
- Subscribe to RSS Feed
- Permalink
- Report Inappropriate Content
I couldn't resist - here is a extension that will display a line chart that's using Morris.
It should be fairly easy to switch to a different chart type.
- Mark as New
- Bookmark
- Subscribe
- Mute
- Subscribe to RSS Feed
- Permalink
- Report Inappropriate Content
Haha, that's pretty epic, Alexander.
Nice work - will check it out during/after the holiday.
On a serious note, it is really nice to see the QV extension space heat up a bit.
Lot's of untapped potential there, we just need to make the JS ninjas realise that QV is cool stuff...
Cheers,
Göran
- Mark as New
- Bookmark
- Subscribe
- Mute
- Subscribe to RSS Feed
- Permalink
- Report Inappropriate Content
Oh yeah and we haven't even been working that much with QV11 lately... 
I would encourage you to check out Qlik Branch which will be a more open source programmer community centered around QV.
Also if you are Swedish you can take a peek at a site I'm building for the swedish election, still under development but has some goodies in terms of code for qv11: QlikView - Intelection 2014
- Mark as New
- Bookmark
- Subscribe
- Mute
- Subscribe to RSS Feed
- Permalink
- Report Inappropriate Content
Now we're talking... Nice!
But why call it "Qlik Branch" when it could so easily have been "Q branch"? Then you could have developed cool gadgets a la Bond too... Oh well, those nasty trademark issues, I guess..
Nice initiatives - keep up the good work.
- Mark as New
- Bookmark
- Subscribe
- Mute
- Subscribe to RSS Feed
- Permalink
- Report Inappropriate Content
Thanks for the info and sharing your script. Is it also possible to add an click event so we can make
an selection within the chart?
// function to handle users clicking on a row
window.oncvlrowclick = function(rowIx)
{
_this.Data.SelectRow(rowIx);
}
- Mark as New
- Bookmark
- Subscribe
- Mute
- Subscribe to RSS Feed
- Permalink
- Report Inappropriate Content
Looking at the documentation for morris.js it dosn't seem like it. They are not exposing any events through their API and not appending any usable class names to the svg paths so it looks like you out of luck.
Also I would advise against building something to substantial on top of this library as it's not actively maintained by anyone. Have a look at Google Charts instead, it's totally free (even for commercial use) and once you grasp the concept of building one chart you can build them all with event handlers, transitions and everything. They also feature some pretty cool and simple geo charts. Have a look at Chart Gallery - Google Charts — Google Developers
- Mark as New
- Bookmark
- Subscribe
- Mute
- Subscribe to RSS Feed
- Permalink
- Report Inappropriate Content
how did you call year and value fields into qlikview
those values are stored in Obj. how we can retrieve those values into qlikview.