Unlock a world of possibilities! Login now and discover the exclusive benefits awaiting you.
- Qlik Community
- :
- All Forums
- :
- QlikView App Dev
- :
- Pareto Analysis to show Top 5 and their contributi...
- Subscribe to RSS Feed
- Mark Topic as New
- Mark Topic as Read
- Float this Topic for Current User
- Bookmark
- Subscribe
- Mute
- Printer Friendly Page
- Mark as New
- Bookmark
- Subscribe
- Mute
- Subscribe to RSS Feed
- Permalink
- Report Inappropriate Content
Pareto Analysis to show Top 5 and their contribution?
Hi All,
I have a requirement to show the Top 5 products in a Pareto Analysis format and their contribution in terms of percentage.
The sales of Top 5 can be displayed by this formulae:
Sum({<Products = {"=Rank(sum(Sales ))<=5"}>} Sales )
But how to show their contribution in terms of percentage? Please help
Here is my sample data below:
Load * Inline
[
Products, Sales
Soap, 1000
Shampoo, 1800
FaceWash, 2000
Moisturizer, 1200
Deodorant, 1600
Perfume, 800
Toner, 600
HairGel, 400
Conditioner, 1400
Sunscreen, 1500
]
;
Accepted Solutions
- Mark as New
- Bookmark
- Subscribe
- Mute
- Subscribe to RSS Feed
- Permalink
- Report Inappropriate Content
SUM({<Products = {"=Rank(SUM(Sales),4)<=5"}>}Sales)/SUM(TOTAL Sales)
Go to Number Tab and Tick Show in Percent %
Update : Check Enclosed File..
- Mark as New
- Bookmark
- Subscribe
- Mute
- Subscribe to RSS Feed
- Permalink
- Report Inappropriate Content
Sum(Sales) / sum( total Sales)
- Mark as New
- Bookmark
- Subscribe
- Mute
- Subscribe to RSS Feed
- Permalink
- Report Inappropriate Content
Hi,
to show only top 5 you can use dimension limits
And to show the perc you can use the following expression
Sum(Sales)/Sum(TOTAL Sales)
and select Integer and Show in percent (%) on Number tab
Sergey
- Mark as New
- Bookmark
- Subscribe
- Mute
- Subscribe to RSS Feed
- Permalink
- Report Inappropriate Content
SUM({<Products = {"=Rank(SUM(Sales),4)<=5"}>}Sales)/SUM(TOTAL Sales)
Go to Number Tab and Tick Show in Percent %
Update : Check Enclosed File..
- Mark as New
- Bookmark
- Subscribe
- Mute
- Subscribe to RSS Feed
- Permalink
- Report Inappropriate Content
Hi,
Try this expression
=Sum({<Products = {"=Rank(Sum(Sales)/ Sum(TOTAL Sales))<=5"}>} Sales ) / Sum(TOTAL Sales)
Regards,
Jagan.
- Mark as New
- Bookmark
- Subscribe
- Mute
- Subscribe to RSS Feed
- Permalink
- Report Inappropriate Content
Simplest way is to
- use the dimension limit
- use the expression sum(Sales)
- and check the 'Relative' checkbox at the expression tab.
See attached example
Hope this helps.
Bert
- Mark as New
- Bookmark
- Subscribe
- Mute
- Subscribe to RSS Feed
- Permalink
- Report Inappropriate Content
Hi All,
Thank you a lot to all of you helping here. I was able to get my desired solution.
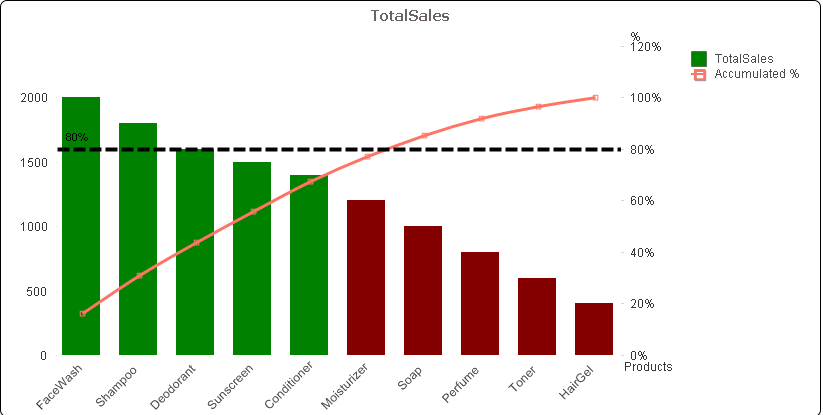
Also, I was showing the Accumulated Sales % (just like mentioned in Pareto Analysis Blog of Henric Cronstom). Now I want to show two Referal Lines (black dotted line): one for Top 5 and other for Top 10. How can I show it dynamically?
Here is the image below:
- Mark as New
- Bookmark
- Subscribe
- Mute
- Subscribe to RSS Feed
- Permalink
- Report Inappropriate Content
Hi,
You just need to put the strings
Min({<Products = {"=Rank(SUM(Sales))<=5"}>}Sales)
and
Min({<Products = {"=Rank(SUM(Sales))<=10"}>}Sales)
to two reference lines.
PFA an example
Sergey