Unlock a world of possibilities! Login now and discover the exclusive benefits awaiting you.
- Qlik Community
- :
- Forums
- :
- Analytics
- :
- New to Qlik Analytics
- :
- Background image in a Scatter Plot?
- Subscribe to RSS Feed
- Mark Topic as New
- Mark Topic as Read
- Float this Topic for Current User
- Bookmark
- Subscribe
- Mute
- Printer Friendly Page
- Mark as New
- Bookmark
- Subscribe
- Mute
- Subscribe to RSS Feed
- Permalink
- Report Inappropriate Content
Background image in a Scatter Plot?
Is actually possible insert an image as background in a scatter plot ?
Thanks a lot.
Accepted Solutions
- Mark as New
- Bookmark
- Subscribe
- Mute
- Subscribe to RSS Feed
- Permalink
- Report Inappropriate Content
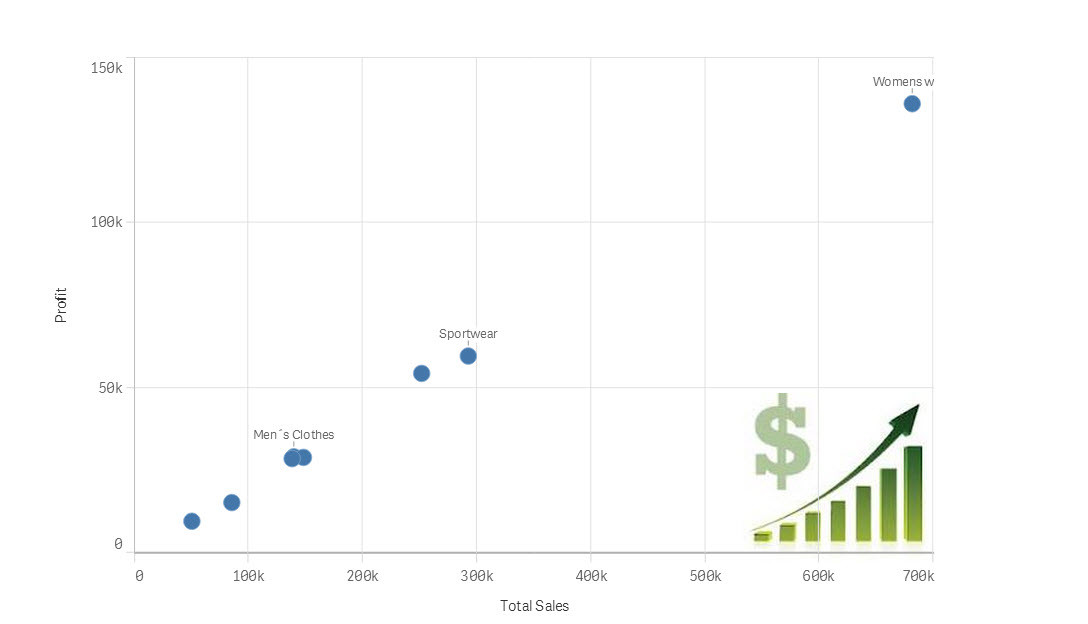
Stefano - not in the actual design of a sheet - BUT - yes in a story using Data Storytelling.
What you can do is layer your snapshot of the chart object over an appropriately sized background image, because the concept of layers exists in Storytelling.
You can copy your images to C:\Users\<user>\Documents\Qlik\Sense\Content\Default\Images
- Restart Desktop
- Then the image will be available in the selection dialog
- In Storytelling you can right click on the object to change the layer.
Mike Tarallo
Qlik
- Mark as New
- Bookmark
- Subscribe
- Mute
- Subscribe to RSS Feed
- Permalink
- Report Inappropriate Content
Stefano - not in the actual design of a sheet - BUT - yes in a story using Data Storytelling.
What you can do is layer your snapshot of the chart object over an appropriately sized background image, because the concept of layers exists in Storytelling.
See screen of a quickly and crude screenshot:
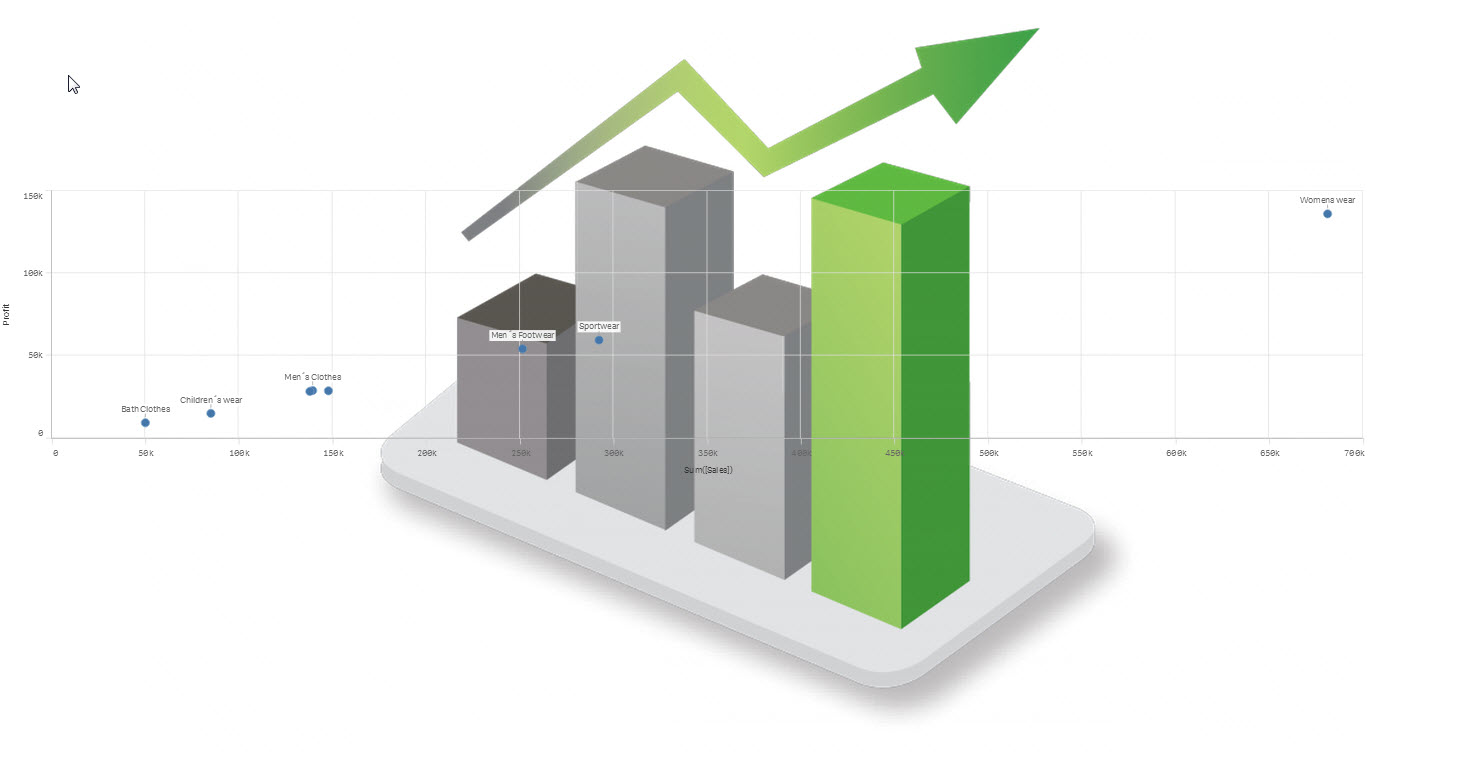
Mike Tarallo - Qlik
Mike Tarallo
Qlik
- Mark as New
- Bookmark
- Subscribe
- Mute
- Subscribe to RSS Feed
- Permalink
- Report Inappropriate Content
Stefano - not in the actual design of a sheet - BUT - yes in a story using Data Storytelling.
What you can do is layer your snapshot of the chart object over an appropriately sized background image, because the concept of layers exists in Storytelling.
You can copy your images to C:\Users\<user>\Documents\Qlik\Sense\Content\Default\Images
- Restart Desktop
- Then the image will be available in the selection dialog
- In Storytelling you can right click on the object to change the layer.
Mike Tarallo
Qlik
- Mark as New
- Bookmark
- Subscribe
- Mute
- Subscribe to RSS Feed
- Permalink
- Report Inappropriate Content
Thanks Michael.
I hope this feature appears in future version of Qlik Sense 
- Mark as New
- Bookmark
- Subscribe
- Mute
- Subscribe to RSS Feed
- Permalink
- Report Inappropriate Content
Hello Stefano - I am not sure if this is something that is intended for this type of product. There is a significant distinction between self-service visualizations (Qlik Sense) and guided analytical applications (QlikView) - where QlikView might be more suited to your needs and does have this capability of adding a backgound images to a chart object.
With Sense, if you need to present the information with context and custom graphics - this "technique" I described in Data Storytelling might be the best option.
Also keep in mind there are best practices when defining visualizations, so please take that into consideraton as you design your app.
Check this out: Special Interview With Stephen Few, Dashboard and Data Visualization Expert
A great resource to review and increase your knowledge in this subject.
Regards,
Mike
Mike Tarallo
Qlik
- Mark as New
- Bookmark
- Subscribe
- Mute
- Subscribe to RSS Feed
- Permalink
- Report Inappropriate Content
Dear Stefano,
I'd like to inform you that there should be a wrong email address into you personal account on QlikView, as I am receiving notifications of your activity on the platform. Could you please take a look at your account and change the configuration? Thanks a lot! 🙂
Regards,
Stefano Santin (without final "i")
- Mark as New
- Bookmark
- Subscribe
- Mute
- Subscribe to RSS Feed
- Permalink
- Report Inappropriate Content
Hi Stefano,
my email is correct, "s.santini@[mycompany].it" and I receive email from qlikview correctly.
Have you some mail form me or from me?
- Mark as New
- Bookmark
- Subscribe
- Mute
- Subscribe to RSS Feed
- Permalink
- Report Inappropriate Content
Hi Stefano,
As Mike says, it is possible to do this in Storytelling, however, and you probably know this already (coming from a data visualisation perspective in QV11 and Sense), I would only look to add images to a scatter when the image has a direct link to the placement of the plots, for example a map or floor plan. I would strongly advise against any other "art work" being added when it has no link to the data itself.
I still see people adding images to the back of bar charts which is another BIG no no.
Cheers.
Adam.
- Mark as New
- Bookmark
- Subscribe
- Mute
- Subscribe to RSS Feed
- Permalink
- Report Inappropriate Content
There is a great workaround, when Map widget is used for making scatter plot with background images:
- Mark as New
- Bookmark
- Subscribe
- Mute
- Subscribe to RSS Feed
- Permalink
- Report Inappropriate Content
We have a use case where the Qlik app is provided to clients, appropriately locked down so they cant change the app or data. Sense SaaS is the perfect tool allow clients to explore and self select a solution. They can clearly take images out of Qlik to use in internal presentations or even external marketing (indeed we would encourage it) . What we want to do is water make these images with (say) our logo so its always attributable to us. (I know clients could take the data and rebuild the graphs if they really wanted to get ride of the water mark, but that might be only 5% of users, possibly none). Clearly this a requirement not just limited to scatter plots. Extending the layer functionality of Geo-plots to all plot types would solve our problem, and open up a whole range of composite graphs
Adding a foot note looks clumsy, takes up space and prevents the foot note from being used for something else.
Anybody got any ideas how we can do this at the moment?