Unlock a world of possibilities! Login now and discover the exclusive benefits awaiting you.
- Qlik Community
- :
- All Forums
- :
- QlikView App Dev
- :
- Create a table with filtered result from another t...
- Subscribe to RSS Feed
- Mark Topic as New
- Mark Topic as Read
- Float this Topic for Current User
- Bookmark
- Subscribe
- Mute
- Printer Friendly Page
- Mark as New
- Bookmark
- Subscribe
- Mute
- Subscribe to RSS Feed
- Permalink
- Report Inappropriate Content
Create a table with filtered result from another table
Hello QV Community,
I'm trying to create a line chart with daily, weekly and monthly date points based on date range and do not know how to generate data points based on changing date range. My script generates daily, weekly and monthly points for all dates available and works fine as long as the range covers all availalbe dates, however when the range is changed, new data points need to be generated. Let's say my data includes 6/30 through 7/31 data, that accounts for 32 daily data points, 4 weekly (based on Fri) and 2 month end points used in drop down control. When a user specifies a custom range, he or she is presented with all available for this range daily/weekly or monthly points.
If the date range changes to 7/20 to 7/31, I need to regenerate all point to have 12 daily, 1 weekly and 1 monthly, with 7/20 daily point being 1, 7/25 weekly poing 1 and so on. I'm thinking of creating an internal table with filtered result set (but do not know how), however if there is another way to do it, I would appreciate any suggestion.
Below table depicts what i have after dashboard rebuild and what I need to have is date range changes:
| On load | On selection | ||||||
| Date Point | Daily | Weeky | Monthly | Date Point | Daily | Weeky | Monthly |
| 6/30/2014 | 1 | 1 | 7/20/2014 | 1 | |||
| 7/1/2014 | 2 | 7/21/2014 | 2 | ||||
| 7/2/2014 | 3 | 7/22/2014 | 3 | ||||
| 7/3/2014 | 4 | 7/23/2014 | 4 | ||||
| 7/4/2014 | 5 | 1 | 7/24/2014 | 5 | |||
| 7/5/2014 | 6 | 7/25/2014 | 6 | 1 | |||
| 7/6/2014 | 7 | 7/26/2014 | 7 | ||||
| 7/7/2014 | 8 | 7/27/2014 | 8 | ||||
| 7/8/2014 | 9 | 7/28/2014 | 9 | ||||
| 7/9/2014 | 10 | 7/29/2014 | 10 | ||||
| 7/10/2014 | 11 | 7/30/2014 | 11 | ||||
| 7/11/2014 | 12 | 2 | 7/31/2014 | 12 | 1 | ||
| 7/31/2014 | 32 | 2 | |||||
Thank you in advance
Igor
- Mark as New
- Bookmark
- Subscribe
- Mute
- Subscribe to RSS Feed
- Permalink
- Report Inappropriate Content
Hi there,
I believe the attached doc might help you. You can create a Variable event trigger to select the dates based on users From and To dates.
Hope this helps you
Thanks
AJ
- Mark as New
- Bookmark
- Subscribe
- Mute
- Subscribe to RSS Feed
- Permalink
- Report Inappropriate Content
Hi Ajay,
Thanks for your response!
I have a working chart that is using variables defined by date range, however my challenge is to introduce data points that will get correctly recalculated based on selected range.
Thanks,
Igor
- Mark as New
- Bookmark
- Subscribe
- Mute
- Subscribe to RSS Feed
- Permalink
- Report Inappropriate Content
Do you mind attaching your sample file. I think i might be missing something here.
- Mark as New
- Bookmark
- Subscribe
- Mute
- Subscribe to RSS Feed
- Permalink
- Report Inappropriate Content
Ajay,
Please see below:
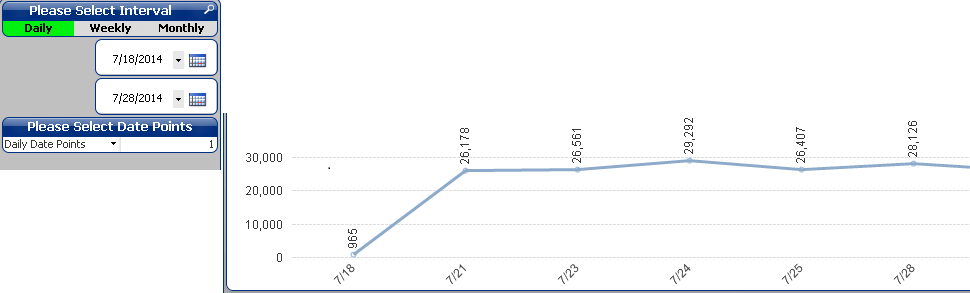
Besides allowing a user specify date range, we also need to provide ability to select data points. If you select 3 data points, the graph will only reflect 7/18, 7/21 and 7/23 dates, not 7/18 through 7/28 specified by range.
- Mark as New
- Bookmark
- Subscribe
- Mute
- Subscribe to RSS Feed
- Permalink
- Report Inappropriate Content
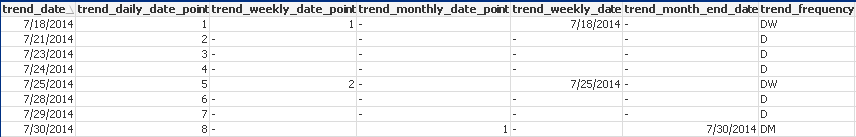
If I understood correctly if user enters Date points as 5 then it will be 7/18,7/21,7/23,7/24,7/25.
If thats the case why dont you try Dimension Limits and display the lowest vValues where vValues is a variable that gets Date Points values from user.