Unlock a world of possibilities! Login now and discover the exclusive benefits awaiting you.
- Qlik Community
- :
- All Forums
- :
- QlikView App Dev
- :
- Obtaining the following set for a selection
- Subscribe to RSS Feed
- Mark Topic as New
- Mark Topic as Read
- Float this Topic for Current User
- Bookmark
- Subscribe
- Mute
- Printer Friendly Page
- Mark as New
- Bookmark
- Subscribe
- Mute
- Subscribe to RSS Feed
- Permalink
- Report Inappropriate Content
Obtaining the following set for a selection
Hi,
I am loading into Qlikview a table with this format:
| Invoice | Date | Month | Client Name | Category |
| 2223 | 01.01.2014 | January | Harry | Home |
| 2224 | 10.01.2014 | January | Harry | School |
| 2225 | 20.01.2014 | January | Paul | Home |
| 2226 | 30.01.2014 | January | John | Acessories |
| 2227 | 04.02.2014 | February | Paul | Technology |
| 2228 | 10.02.2014 | February | Paul | School |
| 2229 | 20.02.2014 | February | Christie | Home |
| 2230 | 21.02.2014 | February | Michael | Technology |
| 2231 | 03.03.2014 | March | Harry | Plants |
My requirement is:
When I select a Month and a Category I need to represent in a bar chart the set of all the following Invoice Categorys for each client in order to know what they've done in the period after the selected category.
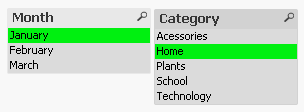
Example:
If I select month January and the category Home I am viewing this data.
| 2223 | 01.01.2014 | January | Harry | Home |
| 2225 | 20.01.2014 | January | Paul | Home |
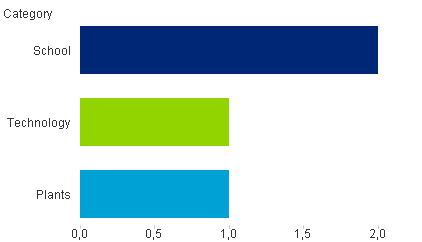
In my chart I want to represent the following Invoice Categorys for each client:
| 2224 | 10.01.2014 | January | Harry | School |
| 2227 | 04.02.2014 | February | Paul | Technology |
| 2228 | 10.02.2014 | February | Paul | School |
| 2231 | 03.03.2014 | March | Harry | Plants |
The desired bar chart is this:
How can I achieve this?
Thanks in advance.
Kind Regards,
Luís
- Mark as New
- Bookmark
- Subscribe
- Mute
- Subscribe to RSS Feed
- Permalink
- Report Inappropriate Content
Anyone to help?
- Mark as New
- Bookmark
- Subscribe
- Mute
- Subscribe to RSS Feed
- Permalink
- Report Inappropriate Content
Hi
This is the expression you want:
=COUNT({$<Category =-{$(=Concat(Text(chr(34))&GetFieldSelections(Category,Chr(34)&','&chr(34),',')&Text(chr(34))))}>}Invoice)
Notice: Be aware there is a minus sign after de equal.
Hope this help.
- Mark as New
- Bookmark
- Subscribe
- Mute
- Subscribe to RSS Feed
- Permalink
- Report Inappropriate Content
Here you have my proposal
- Mark as New
- Bookmark
- Subscribe
- Mute
- Subscribe to RSS Feed
- Permalink
- Report Inappropriate Content
Hi Enrique
your solution does not meet our requirements 
do you have another proposal?
thanks
- Mark as New
- Bookmark
- Subscribe
- Mute
- Subscribe to RSS Feed
- Permalink
- Report Inappropriate Content
Hi Miguel,
your solution does not meet our requirements
do you have another proposal?
thanks