Unlock a world of possibilities! Login now and discover the exclusive benefits awaiting you.
- Qlik Community
- :
- All Forums
- :
- QlikView App Dev
- :
- Interpretting listbox filter differently in result
- Subscribe to RSS Feed
- Mark Topic as New
- Mark Topic as Read
- Float this Topic for Current User
- Bookmark
- Subscribe
- Mute
- Printer Friendly Page
- Mark as New
- Bookmark
- Subscribe
- Mute
- Subscribe to RSS Feed
- Permalink
- Report Inappropriate Content
Interpretting listbox filter differently in result
Hello Team,
I have a list box 'Location'.
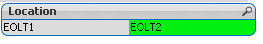
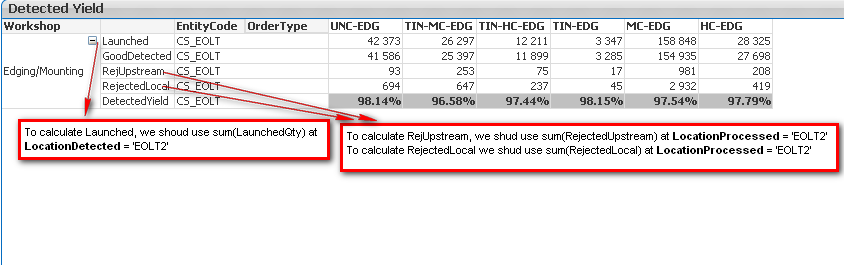
I have to flter 2 different columns(LocationDetected and LocationProcessed) on the same filter and display it in 1 table chart.
Please see below for more details:
I should display only one 'location' listbox
Please suggest, How can i achieve this.
Thanks,
Deepa V
- Tags:
- new_to_qlikview
- Mark as New
- Bookmark
- Subscribe
- Mute
- Subscribe to RSS Feed
- Permalink
- Report Inappropriate Content
You can use a data island table that contains your locations. To make sure it's a data island that table should not be associated with any other table. So it should have field names that do not exist in the other tables. You will need an expression that uses the dimension that contains the values Launched, GoodDetected, ...etc and the new Location island field. Something like:
peek(match( MyDimension, 'Launched','GoodDetected','RejUpstream','RejectedLocal','DetectedYield'), sum({<LocationDetected={'$(=only(Location))'}>}LaunchedQty),
sum({<LocationSomewhere={'$(=only(Location))'}>}SomeThingToSum),
sum({<LocationProcessed={'$(=only(Location))'}>}RejectedUpstream),
sum({<LocationProcessed={'$(=only(Location))'}>}RejectedLocal),
sum({<LocationSomewhereElse={'$(=only(Location))'}>}SomeThingElseToSum))
talk is cheap, supply exceeds demand
- Mark as New
- Bookmark
- Subscribe
- Mute
- Subscribe to RSS Feed
- Permalink
- Report Inappropriate Content
Hello Gysbert,
Thank you for the advice, It works when one of the value is selected from the listbox populated with filed from Isolated table.
I have below business rules
1 . Location is dependent on another filed 'Lab', since we display it as an isolated field, it will display all values as associated irrespective of selected 'Lab'
2. When 'None' of the values is selected in 'Location' filter or More than one value is selected, it displays empty table chart.
Please help me how can i achieve this.