Unlock a world of possibilities! Login now and discover the exclusive benefits awaiting you.
- Qlik Community
- :
- All Forums
- :
- QlikView App Dev
- :
- Still showing negative value on the graph in a Sum
- Subscribe to RSS Feed
- Mark Topic as New
- Mark Topic as Read
- Float this Topic for Current User
- Bookmark
- Subscribe
- Mute
- Printer Friendly Page
- Mark as New
- Bookmark
- Subscribe
- Mute
- Subscribe to RSS Feed
- Permalink
- Report Inappropriate Content
Still showing negative value on the graph in a Sum
Hi,
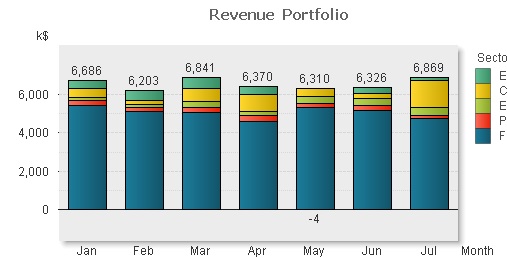
I use a Sum Value in a graph, but I've got an issue, in some cases it's still showing negative value rather than taking it part of the sum...
See below example.
Any way to fix that?
Thanks.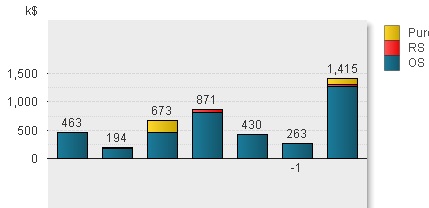
- Tags:
- new_to_qlikview
Accepted Solutions
- Mark as New
- Bookmark
- Subscribe
- Mute
- Subscribe to RSS Feed
- Permalink
- Report Inappropriate Content
Hi,
If you have negative values by dimension for an expression then you will get negative values, if you want to avoid use
Fabs() to make it to positive.
Convert this chart to Straight Table so that you can now where you are getting negative values.
You can also try Chart Properties-> Axes-> Set Static Min as 0.
Hope this helps you.
Regards,
jagan.
- Mark as New
- Bookmark
- Subscribe
- Mute
- Subscribe to RSS Feed
- Permalink
- Report Inappropriate Content
Could you explain a bit more, possibly with your qvw with sample data?
- Mark as New
- Bookmark
- Subscribe
- Mute
- Subscribe to RSS Feed
- Permalink
- Report Inappropriate Content
Hi,
If you have negative values by dimension for an expression then you will get negative values, if you want to avoid use
Fabs() to make it to positive.
Convert this chart to Straight Table so that you can now where you are getting negative values.
You can also try Chart Properties-> Axes-> Set Static Min as 0.
Hope this helps you.
Regards,
jagan.
- Mark as New
- Bookmark
- Subscribe
- Mute
- Subscribe to RSS Feed
- Permalink
- Report Inappropriate Content
Thanks for your quick answer.
Yes, it happens when one dimension is negative. But I don't want to make it positive. I just want to add it to the sum like all the (other dimensions) and show the sum. (What I want is quite simple, don't understand why it's not the standard way...)
- Mark as New
- Bookmark
- Subscribe
- Mute
- Subscribe to RSS Feed
- Permalink
- Report Inappropriate Content
Forget my point, it is stupid.... I'll find another way to present the graph. (to show negative dimension and the correct sum).
Thanks.