Unlock a world of possibilities! Login now and discover the exclusive benefits awaiting you.
- Qlik Community
- :
- All Forums
- :
- QlikView App Dev
- :
- expression problems
- Subscribe to RSS Feed
- Mark Topic as New
- Mark Topic as Read
- Float this Topic for Current User
- Bookmark
- Subscribe
- Mute
- Printer Friendly Page
- Mark as New
- Bookmark
- Subscribe
- Mute
- Subscribe to RSS Feed
- Permalink
- Report Inappropriate Content
expression problems
HI.
I'm Lee from S.Korea.
I Stuck in problem.
first of all.
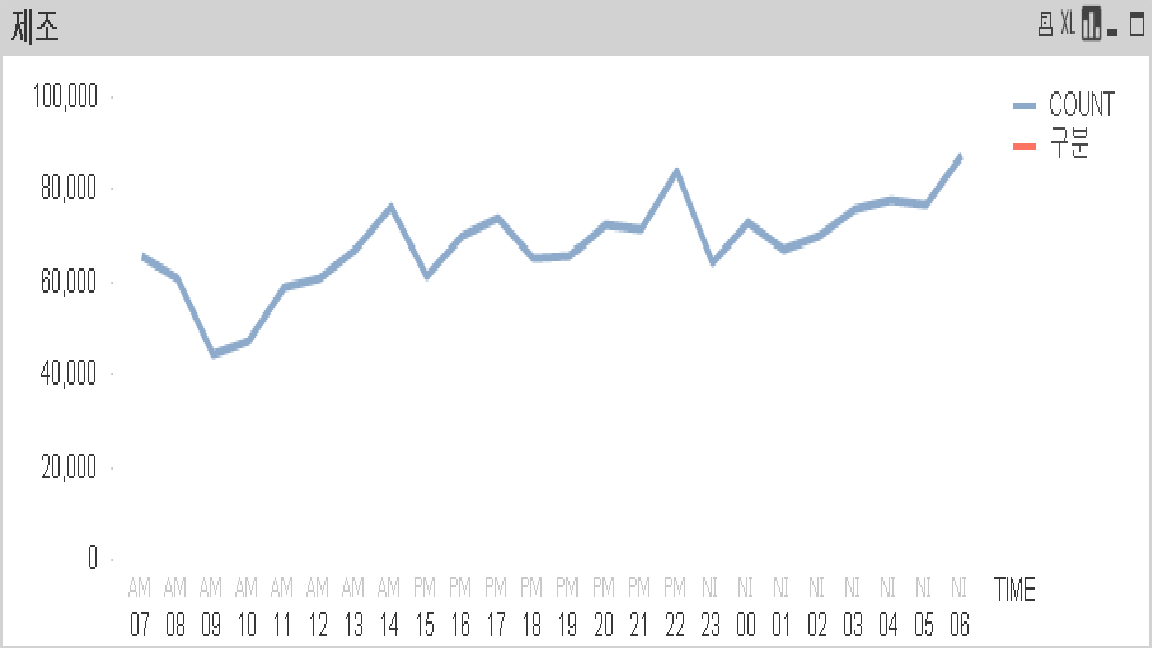
Chart Properties -> Expressions --> Add --> 구분 ..(sorry .. just Called 'Time')---> Display Options (Text on Axis) -Check
the result is above image.
but i want to Have Axis name..... Distict.
for example
AM PM NI
07 08 09 10 11 12 13 14 15 16 17 18 19 20 21 22 23 00.............06
How can i get this result.
please let me know.
- Tags:
- new_to_qlikview
- Mark as New
- Bookmark
- Subscribe
- Mute
- Subscribe to RSS Feed
- Permalink
- Report Inappropriate Content
Hi Lee,
I'm not sure I understand your problem. The result expected in the axis is the one you are showing in your picture... so, please, can you explain more specificly what is your purpose?
Marc.
- Mark as New
- Bookmark
- Subscribe
- Mute
- Subscribe to RSS Feed
- Permalink
- Report Inappropriate Content
as you can see
image Axis
AM AM AM AM AM PM PM PM PM PM NI NI NI NI NI
07 08 09 10 11 .. 15 16 17 18 19..00 01 02 03 04
but I want to have
Distinct ''Time'
AM PM NI
07 08 09 10 11 12 13 14 15 16 17 18 19 20 21 22 23 00.............06
AM AM AM ===> AM (only one!)
- Mark as New
- Bookmark
- Subscribe
- Mute
- Subscribe to RSS Feed
- Permalink
- Report Inappropriate Content
ok!
Try to add a first dimension with the 'AM','PM,'NI', and a second dimension with the time, and show both in chart.
Marc.
- Mark as New
- Bookmark
- Subscribe
- Mute
- Subscribe to RSS Feed
- Permalink
- Report Inappropriate Content
Hi lee,
Do you mean that, you want to group all the AM hours into a Group "AM" and so on and display the same in Chart?
Can you please share the sample sheet?
Regards
KC
KC