Unlock a world of possibilities! Login now and discover the exclusive benefits awaiting you.
- Qlik Community
- :
- All Forums
- :
- QlikView App Dev
- :
- How to show following bar chart ??
- Subscribe to RSS Feed
- Mark Topic as New
- Mark Topic as Read
- Float this Topic for Current User
- Bookmark
- Subscribe
- Mute
- Printer Friendly Page
- Mark as New
- Bookmark
- Subscribe
- Mute
- Subscribe to RSS Feed
- Permalink
- Report Inappropriate Content
How to show following bar chart ??
HEy,
How to make a bar chart as in attached image and how to show policies with circle and premium with square ??
I think 2 expressions one for premium and one for policies are there but dot know how to show one with circle and other with square.
Please help
Thanks
- Tags:
- new_to_qlikview
- Mark as New
- Bookmark
- Subscribe
- Mute
- Subscribe to RSS Feed
- Permalink
- Report Inappropriate Content
Hi Nikhil,
Try Combo chart, for expression "Avg. Premium" check "Bar" option
For expression "No. of Policies" check "Symbol" option and select "Circle" in the dropdown.
Thanks,
Sri
- Mark as New
- Bookmark
- Subscribe
- Mute
- Subscribe to RSS Feed
- Permalink
- Report Inappropriate Content
Hi Nikhil,
Its just a simple Combo chart with 1 cyclic group and 2 expressions.
With different style.
have a look at attached image.
Regards
ASHFAQ
- Mark as New
- Bookmark
- Subscribe
- Mute
- Subscribe to RSS Feed
- Permalink
- Report Inappropriate Content
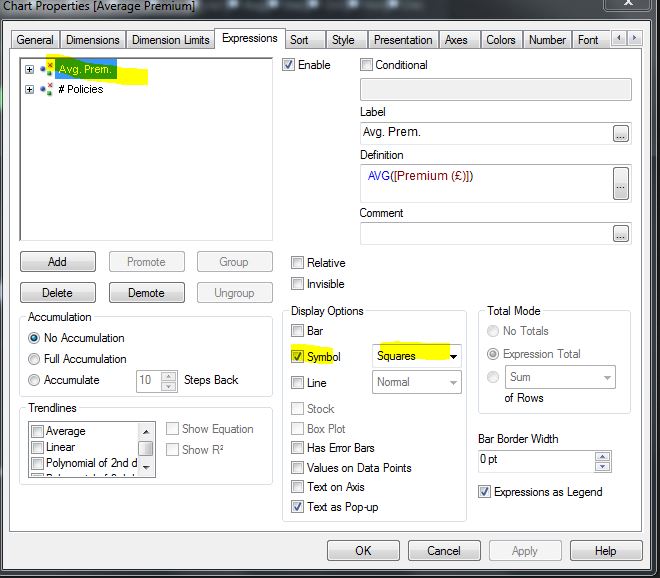
Hi,
Basically it was Combo Chart there are two expression.
In chart property-> Expression tab->select 1st expression ->display Option check only as Bar
select 2nd Expression -> uncheck as Bar-> checked as Symbol
and go to Style tab-> change Orientation as per requirement.
Regards
Please appreciate our Qlik community members by giving Kudos for sharing their time for your query. If your query is answered, please mark the topic as resolved 🙂
- Mark as New
- Bookmark
- Subscribe
- Mute
- Subscribe to RSS Feed
- Permalink
- Report Inappropriate Content
Hi Nikhil,
Please follow the steps that are given in the attached document.
Hope that helps.
Thanks and Regards,
Geeta