Unlock a world of possibilities! Login now and discover the exclusive benefits awaiting you.
- Qlik Community
- :
- All Forums
- :
- QlikView App Dev
- :
- single bar chart to include bars of multiple indic...
- Subscribe to RSS Feed
- Mark Topic as New
- Mark Topic as Read
- Float this Topic for Current User
- Bookmark
- Subscribe
- Mute
- Printer Friendly Page
- Mark as New
- Bookmark
- Subscribe
- Mute
- Subscribe to RSS Feed
- Permalink
- Report Inappropriate Content
single bar chart to include bars of multiple indicator variables
I have a wide dataset that includes many chronic condition indicators, and I want to see all of these on the same bar chart.
For example:
Patient_ID Start_Dt End_Dt chf_ind copd_ind diabetes_ind ckd_ind ..... etc
1 1/1/2012 12/31/2012 1 0 0 0
2 1/1/2012 12/31/2012 0 0 1 1
3 1/1/2012 12/31/2012 1 1 1 1
What I did is keep this dataset with all indicator variables as the fact table and then transposed the data into 1 row per patient per time frame per condition (indicator variable=1).
For, example:
Patient_ID Start_Dt End_Dt condition
1 1/1/2012 12/31/2012 CHF
2 1/1/2012 12/31/2012 DIABETES
2 1/1/2012 12/31/2012 CKD
3 1/1/2012 12/31/2012 CHF
3 1/1/2012 12/31/2012 COPD
3 1/1/2012 12/31/2012 DIABETES
I used the transposed variable condition for the bar chart to be able to see in descending order the frequency of conditions. However, if I select any condition within the bar chart, it does not show me what other conditions these patients have. For example, I want to be able to select the CHF bar and see that of patients with CHF, the other coexisting conditions they have are COPD and DIABETES. I had to create listboxes and buttons to select the indicator variable from the fact table to update the bar chart with this information.
Do you have any recommendations for another way of doing this? Where you have a number of indicator variables that you want to see on the same chart like this?
Thank you!
- « Previous Replies
-
- 1
- 2
- Next Replies »
Accepted Solutions
- Mark as New
- Bookmark
- Subscribe
- Mute
- Subscribe to RSS Feed
- Permalink
- Report Inappropriate Content
- Mark as New
- Bookmark
- Subscribe
- Mute
- Subscribe to RSS Feed
- Permalink
- Report Inappropriate Content
Hi,
We did this a while ago. The trick is to make a data island with conditions, and select all customers that have that condition with the P()-function.
Script:
data:
LOAD * INLINE [
Patient_ID, Start_Dt , End_Dt , condition
1 , 1/1/2012 , 12/31/2012 , CHF
2 , 1/1/2012 , 12/31/2012 , DIABETES
2 , 1/1/2012 , 12/31/2012 , CKD
3 , 1/1/2012 , 12/31/2012 , CHF
3 , 1/1/2012 , 12/31/2012 , COPD
3 , 1/1/2012 , 12/31/2012 , DIABETES
];
condition_data_island:
LOAD distinct condition as selected_condition
resident data;
Chart (the expression is in the title):
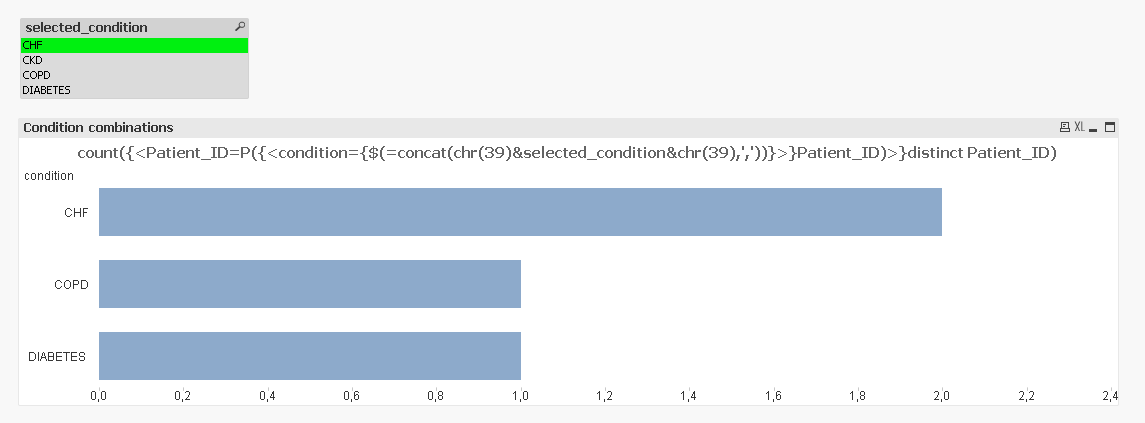
Mark
- Mark as New
- Bookmark
- Subscribe
- Mute
- Subscribe to RSS Feed
- Permalink
- Report Inappropriate Content
Hi Mark,
Could you provide the qvw of what you pasted in the response above? It isn't working for me so I wanted to double check a few things.
Thank you!
- Mark as New
- Bookmark
- Subscribe
- Mute
- Subscribe to RSS Feed
- Permalink
- Report Inappropriate Content
Hi,
Here it is.
Mark
- Mark as New
- Bookmark
- Subscribe
- Mute
- Subscribe to RSS Feed
- Permalink
- Report Inappropriate Content
Okay, thanks! Do you know of any way to use this approach with a cycle group? For example, I happen to have 5 different ways that chronic conditions are measured (the condition indicators above are grouped into frailty conditions, conditions that result in high mortality rates, currently managed, hccs etc), so I was using a cycle group that had these different condition type fields.
- Mark as New
- Bookmark
- Subscribe
- Mute
- Subscribe to RSS Feed
- Permalink
- Report Inappropriate Content
KM,
I'm not sure I understand your additional question. Do you still want te select a specific condition (like DIABETES) and only see the 'related' conditions from one group (like FRAILTY), or do you want to select a group of conditions and see all related conditions ? Perhaps, you could give me a more detailed example of data and expected result ?
Greets,
Mark
- Mark as New
- Bookmark
- Subscribe
- Mute
- Subscribe to RSS Feed
- Permalink
- Report Inappropriate Content
Hi Mark,
From the example above, let's just say CHF and COPD belonged to one condition type, and DIABETES and CKD had other characteristics belonging to another condition type. I would have two separate data tables, one for each condition type. For example:
data_conditiontype1:
LOAD * INLINE
[ Patient_ID, Start_Dt , End_Dt , conditiontype1
1 , 1/1/2012 , 12/31/2012 , CHF
3 , 1/1/2012 , 12/31/2012 , CHF
3 , 1/1/2012 , 12/31/2012 , COPD
];
data_conditiontype2
LOAD * INLINE
[ Patient_ID, Start_Dt , End_Dt , conditiontype2
2 , 1/1/2012 , 12/31/2012 , DIABETES
2 , 1/1/2012 , 12/31/2012 , CKD
3 , 1/1/2012 , 12/31/2012 , DIABETES
];
Condition types 1 and two would be in the same cycle group. Does that make sense?
- Mark as New
- Bookmark
- Subscribe
- Mute
- Subscribe to RSS Feed
- Permalink
- Report Inappropriate Content
Hi KM,
If these groups are relevant, i would add them to your data. You can add them in de data itself:
LOAD * INLINE
[ Patient_ID, Start_Dt , End_Dt , conditiontype, conditiongroup
1 , 1/1/2012 , 12/31/2012 , CHF, Group1
3 , 1/1/2012 , 12/31/2012 , CHF, Group1
3 , 1/1/2012 , 12/31/2012 , COPD, Group1
];
Then you can use the conditiongroup var directly in your charts or as a cyclic group. (extra remark : as you can see you should change the var names conditiontype1 and conditiontype2 in conditiontype so that conditiontypes of both tables end up in the same var in one table).
If you have a lot of data, you can also load a seperate table like this (QV will link the tables automatically):
LOAD * Inline [
conditiontype, conditiongroup
CHF, Group1
COPD,Group1
DIABETES, Group2
CKD,Group2
];
Mark
- Mark as New
- Bookmark
- Subscribe
- Mute
- Subscribe to RSS Feed
- Permalink
- Report Inappropriate Content
Hi Mark,
What would the cycle group be? I want to be able to cycle through conditiongroup to see condition types all in one table like the original example you posted above. From my understanding, if conditiongroup was the cycle group, then the bar chart would contain only 1 bar for Group 1, and cycle through to 1 bar for Group 2, etc. I want all conditions for each condition group to be shown when that condition group is selected
- Mark as New
- Bookmark
- Subscribe
- Mute
- Subscribe to RSS Feed
- Permalink
- Report Inappropriate Content
KM,
You were correct to put the condition_types in 2 different variables to enable cycle groups.
I added them to the example.
Ok ?
Mark
- « Previous Replies
-
- 1
- 2
- Next Replies »