Unlock a world of possibilities! Login now and discover the exclusive benefits awaiting you.
- Qlik Community
- :
- All Forums
- :
- QlikView App Dev
- :
- Sort
- Subscribe to RSS Feed
- Mark Topic as New
- Mark Topic as Read
- Float this Topic for Current User
- Bookmark
- Subscribe
- Mute
- Printer Friendly Page
- Mark as New
- Bookmark
- Subscribe
- Mute
- Subscribe to RSS Feed
- Permalink
- Report Inappropriate Content
Sort
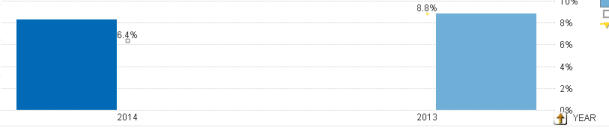
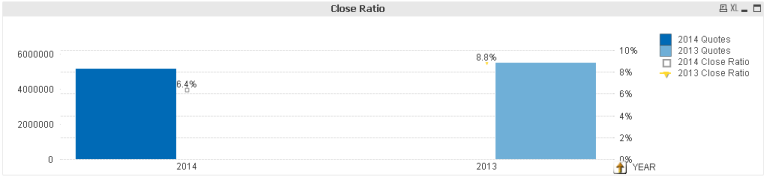
Looking for help on a way to clean up this bar graph. I am sorting by 2014, then by 2013 for year. And on a drill down function allowing for the graph to go by month. I have used the following formula to sort the graph:
=
mixMatch(YEAR, '2014', '2013')
=MixMatch(MONTH, 1,2,3,4,5,6,7,8,9,10,11,12)
=IF(YEAR=2013,MixMatch(MONTH, 1,2,3,4,5,6,7,8,9,10,11,12))
Using this formula the months show up fine, but the year has a space distortion that the user would like fixed. Is there a way to fix this when using 4 expressions, two showing number of quotes, and two showing close ratio? Here is my picture:
Accepted Solutions
- Mark as New
- Bookmark
- Subscribe
- Mute
- Subscribe to RSS Feed
- Permalink
- Report Inappropriate Content
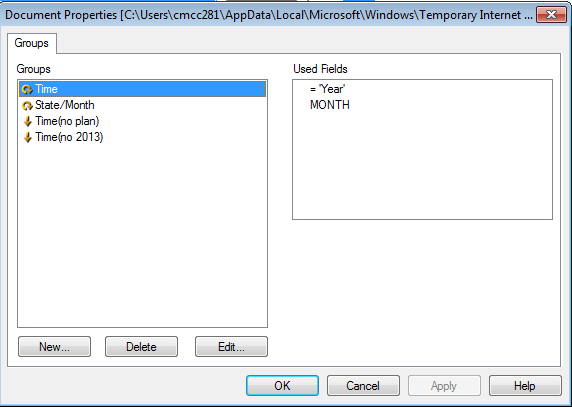
Its a bit of a hack but if you change it to a cyclical group and create a fake demension e.g = 'Year' it would work if the user is happy to select the cyclical icon to drill down
- Mark as New
- Bookmark
- Subscribe
- Mute
- Subscribe to RSS Feed
- Permalink
- Report Inappropriate Content
It looks like there is some expression being 0, but still using some space there. I don't really understand how you want your chart and why you are using mixmatch in this way. Can you upload the application (ok without the data) and an image of the chart you are trying to show?
- Mark as New
- Bookmark
- Subscribe
- Mute
- Subscribe to RSS Feed
- Permalink
- Report Inappropriate Content
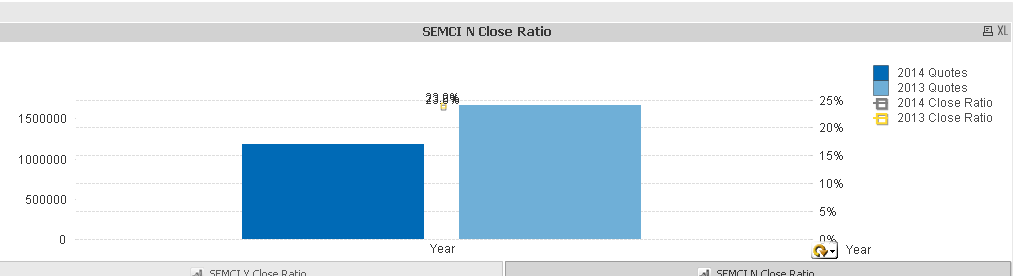
Morgan,
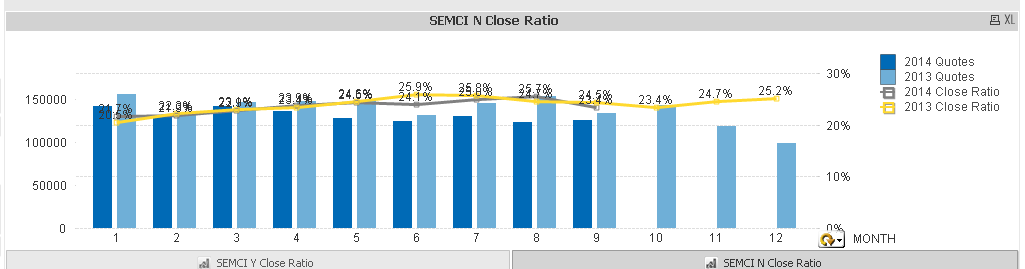
The user would like the representation of quotes for 2014 next to quotes for 2013 with a close ratio representation. They would then like to drill down by month, in the same order, with the months going Jan-Dec.
Attached is a picture with the QVW file as well.
- Mark as New
- Bookmark
- Subscribe
- Mute
- Subscribe to RSS Feed
- Permalink
- Report Inappropriate Content
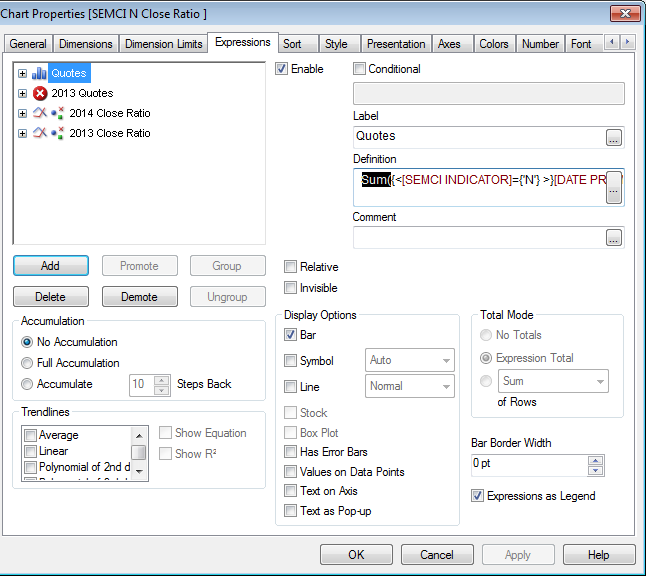
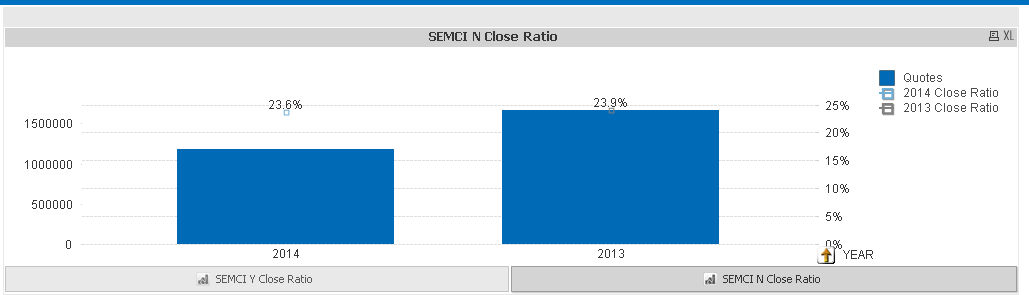
Rename 2014 Quotes to Quotes and change the expression to this
sum({<[SEMCI INDICATOR]={'N'} >}[DATE PROMPT QUOTES])
disable 2013 Quotes as per below
- Mark as New
- Bookmark
- Subscribe
- Mute
- Subscribe to RSS Feed
- Permalink
- Report Inappropriate Content
Sort misintpreted the problem, it's the drill down issue... let me have a look
- Mark as New
- Bookmark
- Subscribe
- Mute
- Subscribe to RSS Feed
- Permalink
- Report Inappropriate Content
Carly,
Thank you that works for Year as it clears up the space. But the user is also looking for the drill down. When they go to the month view, they would like to see 2013 vs 2014 by month. When you drill down with the changes you gave, it will only show one year in the month view. Any suggestions to add it in, like some sort of dimensionality or another function?
- Mark as New
- Bookmark
- Subscribe
- Mute
- Subscribe to RSS Feed
- Permalink
- Report Inappropriate Content
Its a bit of a hack but if you change it to a cyclical group and create a fake demension e.g = 'Year' it would work if the user is happy to select the cyclical icon to drill down
- Mark as New
- Bookmark
- Subscribe
- Mute
- Subscribe to RSS Feed
- Permalink
- Report Inappropriate Content
Carly,
Thank you for the help. That did get rid of the space. Is there any reason for the space with my initial graph? Also, do you think there is a different way to complete the task as well?
- Mark as New
- Bookmark
- Subscribe
- Mute
- Subscribe to RSS Feed
- Permalink
- Report Inappropriate Content
Yes because it is trying to evaluate each expression per demension value
e.g
demension expression
2014 2014
2014 2013 returns blank but leaves space
2013 2014 returns blank but leaves space
2013 2013
p.s can you make this as answered if it has fixed it for you.
- Mark as New
- Bookmark
- Subscribe
- Mute
- Subscribe to RSS Feed
- Permalink
- Report Inappropriate Content
Thank you Carly. I appreciate the help and the explanation.