Unlock a world of possibilities! Login now and discover the exclusive benefits awaiting you.
- Qlik Community
- :
- All Forums
- :
- QlikView App Dev
- :
- Hi, I've just joined Qlik, I am trying to create a...
- Subscribe to RSS Feed
- Mark Topic as New
- Mark Topic as Read
- Float this Topic for Current User
- Bookmark
- Subscribe
- Mute
- Printer Friendly Page
- Mark as New
- Bookmark
- Subscribe
- Mute
- Subscribe to RSS Feed
- Permalink
- Report Inappropriate Content
Hi, I've just joined Qlik, I am trying to create a bubble chart but can't get the bubble to change size dependent on the third expression. what am I doing wrong?! I had originally a large data set but tried a simple set of 10 items and same result.
Hi, I've just joined Qlik, I am trying to create a bubble chart but can't get the bubble to change size dependent on the third expression. What am I doing wrong?! I had originally a large data set but in attempt to see what i was doing wrong I tried using a simple spreadsheet with only a set of 10 items (see attached) and got the same result.
- « Previous Replies
-
- 1
- 2
- Next Replies »
Accepted Solutions
- Mark as New
- Bookmark
- Subscribe
- Mute
- Subscribe to RSS Feed
- Permalink
- Report Inappropriate Content
Change your third expression from sum[Z value] to sum([Z value])
talk is cheap, supply exceeds demand
- Mark as New
- Bookmark
- Subscribe
- Mute
- Subscribe to RSS Feed
- Permalink
- Report Inappropriate Content
See also Recipe for a Scatter Chart
HIC
- Mark as New
- Bookmark
- Subscribe
- Mute
- Subscribe to RSS Feed
- Permalink
- Report Inappropriate Content
I assume you meant to say you're creating a scatter chart. A bubble chart requires two dimensions. I also experienced the problem you described. The third expression sum([Z Value]) I added did not result in different bubble sizes. When I created a new document the chart worked correctly. I haven't been able to reproduce the problem again.
talk is cheap, supply exceeds demand
- Mark as New
- Bookmark
- Subscribe
- Mute
- Subscribe to RSS Feed
- Permalink
- Report Inappropriate Content
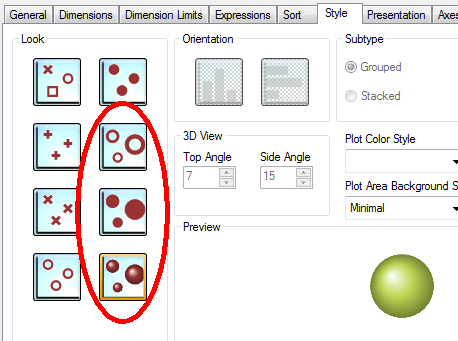
It could be that the wrong style was chosen. You need to have one of the bottom right three.
HIC
- Mark as New
- Bookmark
- Subscribe
- Mute
- Subscribe to RSS Feed
- Permalink
- Report Inappropriate Content
That wasn't the problem. The lower right style is the default. I tried the others as well. But as I said, I can't seem to reproduce it anymore.
talk is cheap, supply exceeds demand
- Mark as New
- Bookmark
- Subscribe
- Mute
- Subscribe to RSS Feed
- Permalink
- Report Inappropriate Content
Hi Gysbert / Henric
Firstly, thanks for your help! I have selected the scatter plot as suggested by Henric. I am looking to create a bubble chart (scatter chart with 3 dimensions, X, Y and Z). Please see the chart I currently get and what has been set up in properties. I was expecting the bubble sizes to be different as the values for that dimension are different.
- Mark as New
- Bookmark
- Subscribe
- Mute
- Subscribe to RSS Feed
- Permalink
- Report Inappropriate Content
Sorry, tried to paste the screenshots in but doesn't seem to have worked. I have inserted as an image below.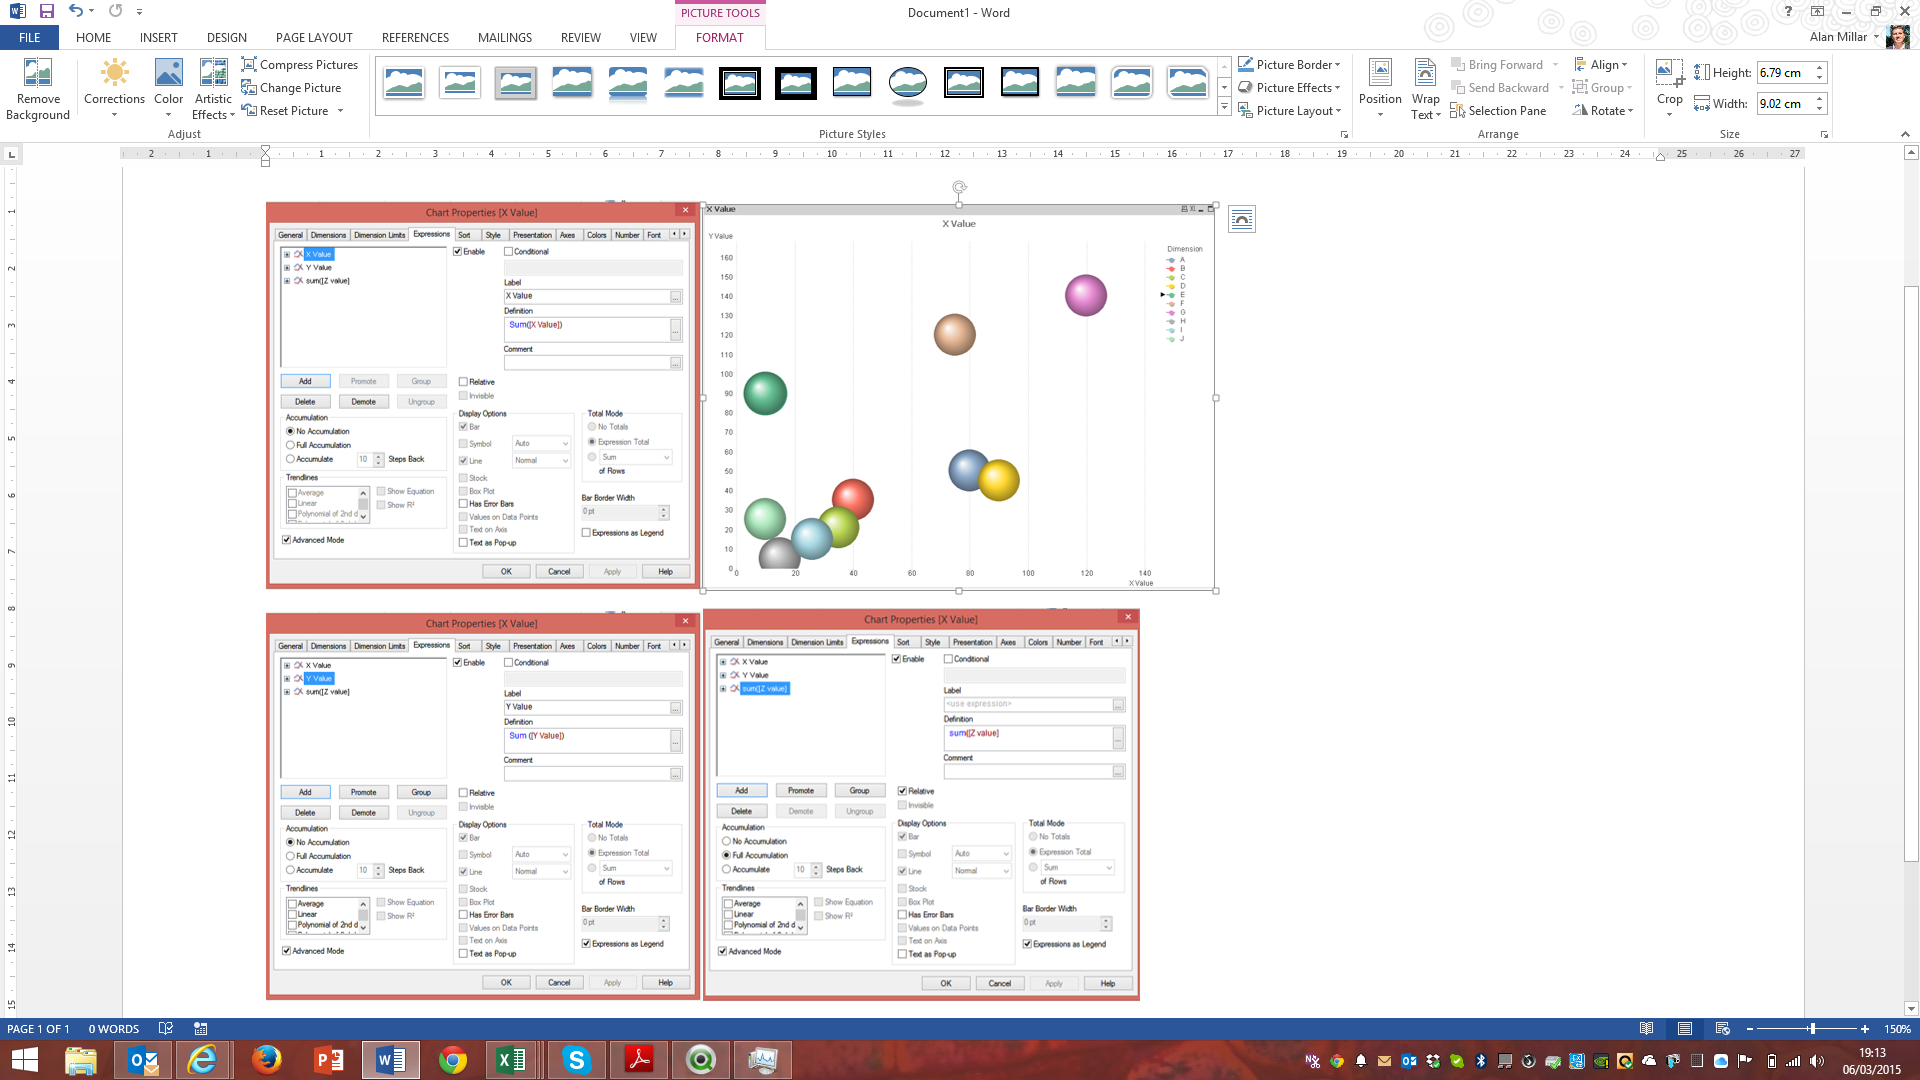
- Mark as New
- Bookmark
- Subscribe
- Mute
- Subscribe to RSS Feed
- Permalink
- Report Inappropriate Content
It's not possible to say just from the picture. Everything in the picture looks OK. So I would check the following:
- That the style is the right one (see my previous comment)
- That the numbers really are different for the different bubbles. Maybe they are the same? Convert to a pivot table to see the numbers.
HIC
- Mark as New
- Bookmark
- Subscribe
- Mute
- Subscribe to RSS Feed
- Permalink
- Report Inappropriate Content
Hi Henric
The style is the one you originally suggested.
Here are the numbers, I deliberately created a simple data set (only 3 columns of 10 rows! Original sheet was many columns and 1000s of rows). As you can see Z dimension numbers are all different, the largest being 15 times bigger than smallest:
| Dimension | Y Value | X Value | Z value |
| A | 50 | 80 | 20 |
| B | 35 | 40 | 300 |
| C | 21 | 35 | 25 |
| D | 45 | 90 | 150 |
| E | 90 | 10 | 200 |
| F | 120 | 75 | 10 |
| G | 140 | 120 | 90 |
| H | 5 | 15 | 75 |
| I | 15 | 26 | 10 |
| J | 25 | 10 | 140 |
Any ideas?
Alan
- Mark as New
- Bookmark
- Subscribe
- Mute
- Subscribe to RSS Feed
- Permalink
- Report Inappropriate Content
Try going to Presentation, uncheck "Autosize Symbols". Then increase the "max bubble size".
-Rob
- « Previous Replies
-
- 1
- 2
- Next Replies »