Unlock a world of possibilities! Login now and discover the exclusive benefits awaiting you.
- Qlik Community
- :
- Forums
- :
- Analytics
- :
- New to Qlik Analytics
- :
- Sparklines (micro charts) in QlikSense
- Subscribe to RSS Feed
- Mark Topic as New
- Mark Topic as Read
- Float this Topic for Current User
- Bookmark
- Subscribe
- Mute
- Printer Friendly Page
- Mark as New
- Bookmark
- Subscribe
- Mute
- Subscribe to RSS Feed
- Permalink
- Report Inappropriate Content
Sparklines (micro charts) in QlikSense
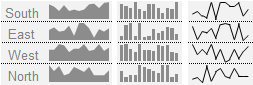
Does anyone know whether it is possible to make Sparklines, so you can combine charts and tables to make data dense "graphic tables" or trellises? I am thinking primarily of basic "micro charts" like line, columns and area.
- Mark as New
- Bookmark
- Subscribe
- Mute
- Subscribe to RSS Feed
- Permalink
- Report Inappropriate Content
Hello Ulrik,
No not at this time - you may want to check - http://branch.qlik.com/ to see if an extension object exists.
Please mark the appropriate replies as CORRECT / HELPFUL so our team and other members know that your question(s) has been answered to your satisfaction.
Regards,
Mike Tarallo
Qlik
Mike Tarallo
Qlik
- Mark as New
- Bookmark
- Subscribe
- Mute
- Subscribe to RSS Feed
- Permalink
- Report Inappropriate Content
Thanks Mike.
I will check it out.
- Mark as New
- Bookmark
- Subscribe
- Mute
- Subscribe to RSS Feed
- Permalink
- Report Inappropriate Content
Hi Mike,
I found a Github extension for this - GitHub - mwz05github/DynamicTableSparkline: Qlik Sense Dynamic Table with Sparklines
However, it does not let me edit the sparkline as I want. Moreover, is there a way I can select last 5 data points in my sparkline?
Is there a solution around this?
- Mark as New
- Bookmark
- Subscribe
- Mute
- Subscribe to RSS Feed
- Permalink
- Report Inappropriate Content
Check out Vizlib's new Table extension. It supports rich formatting options for sparklines:
- Mark as New
- Bookmark
- Subscribe
- Mute
- Subscribe to RSS Feed
- Permalink
- Report Inappropriate Content
If You don't want to use extensions, maybe this will help: