Unlock a world of possibilities! Login now and discover the exclusive benefits awaiting you.
- Qlik Community
- :
- All Forums
- :
- QlikView App Dev
- :
- how to include a bar chart in straight table
- Subscribe to RSS Feed
- Mark Topic as New
- Mark Topic as Read
- Float this Topic for Current User
- Bookmark
- Subscribe
- Mute
- Printer Friendly Page
- Mark as New
- Bookmark
- Subscribe
- Mute
- Subscribe to RSS Feed
- Permalink
- Report Inappropriate Content
how to include a bar chart in straight table
Please can any one show me how to include a bar chart in a straight table?
- Mark as New
- Bookmark
- Subscribe
- Mute
- Subscribe to RSS Feed
- Permalink
- Report Inappropriate Content
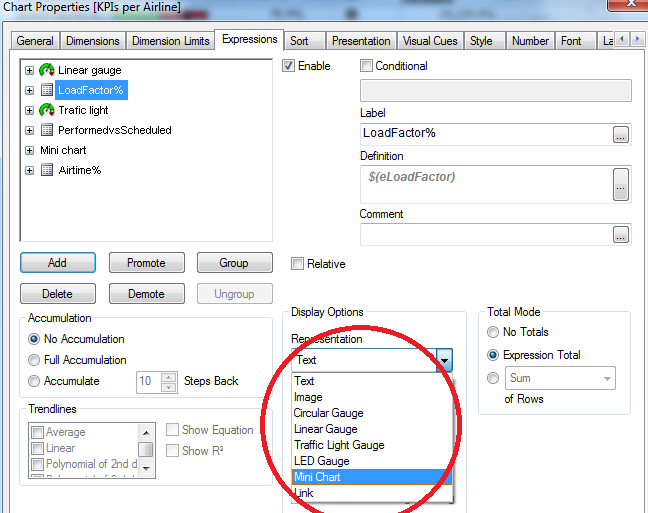
Choose representation mini-chart for your expression. In mini chart settings, select "Bars" mode and define Dimension. See attached.
- Mark as New
- Bookmark
- Subscribe
- Mute
- Subscribe to RSS Feed
- Permalink
- Report Inappropriate Content
- Mark as New
- Bookmark
- Subscribe
- Mute
- Subscribe to RSS Feed
- Permalink
- Report Inappropriate Content
Hi,
Try bar chart in straight table in expression tab
- Mark as New
- Bookmark
- Subscribe
- Mute
- Subscribe to RSS Feed
- Permalink
- Report Inappropriate Content
Hi,
Select Expression->Display Option->select Mini Chart->selct Mini chart Setting->select Bar Mode
Regards
Please appreciate our Qlik community members by giving Kudos for sharing their time for your query. If your query is answered, please mark the topic as resolved 🙂
- Mark as New
- Bookmark
- Subscribe
- Mute
- Subscribe to RSS Feed
- Permalink
- Report Inappropriate Content
try from expression tab --
1. Select ur expression and Select "mini chart" form Display options
2. Click on Mini chart settings --Appearances-Mode as "Bars".
- Mark as New
- Bookmark
- Subscribe
- Mute
- Subscribe to RSS Feed
- Permalink
- Report Inappropriate Content
hII
CHECK THE ATTACHED FILE
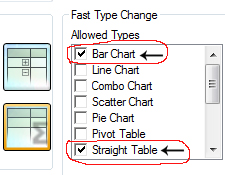
In image check this checkboxes and you can see the bar chart in straight chart
- Mark as New
- Bookmark
- Subscribe
- Mute
- Subscribe to RSS Feed
- Permalink
- Report Inappropriate Content
First select the expression that you want to be a mini chart:
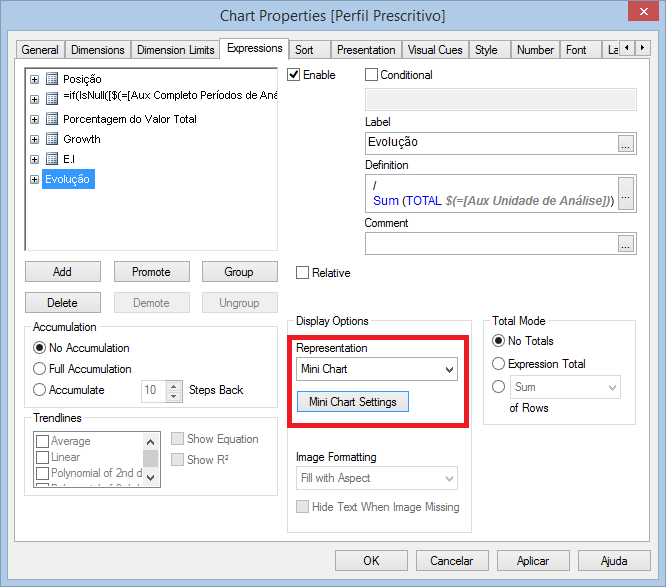
And then you open the "Mini Chart Settings" and choose the dimension, the mode of your chart(Bars in your case) and colors:
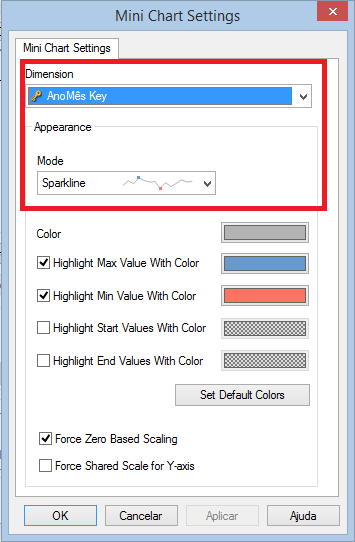
Hope that helps!
- Mark as New
- Bookmark
- Subscribe
- Mute
- Subscribe to RSS Feed
- Permalink
- Report Inappropriate Content
Hi,
I am going to assume that you want to have 1 horizontal bar for each row, and not a mini bar chart on each row.
You will need to create a new expression similar to "Sum(Sales) / Max(Total Aggr(Sum(Sales), [Your Dimension])"
Change Total Mode = No Totals
Then change the Representation = "Linear Gauge".
Gauge Settings (Only 1 Segment)
Min = 0
Max = 1
Mode = Fill to Value
Style = Arrow
Show Scale = False
Autowidth Segments = True
Hide Segment Boundaries = True
Hide Gauge Outlines = True
Colour = Your Choice 
- Mark as New
- Bookmark
- Subscribe
- Mute
- Subscribe to RSS Feed
- Permalink
- Report Inappropriate Content
Change the display option for that expression. You will find it in the same tab i.e. Expression tab. Change it from text to Mini chart. You can set different settings of it by clicking Mini chart setting option right below display option. It will populate as soon as you change display option to Mini chart.