Unlock a world of possibilities! Login now and discover the exclusive benefits awaiting you.
- Qlik Community
- :
- Blogs
- :
- Technical
- :
- Design
- :
- 4 tips to start working with QlikView
- Subscribe to RSS Feed
- Mark as New
- Mark as Read
- Bookmark
- Subscribe
- Printer Friendly Page
- Report Inappropriate Content
A few weeks ago a former colleague, who has recently started to work with QlikView, contacted me and was wondering how to start with QlikView and how to help his team to better visualize data, here are some tips I shared with him that could help you to start too:
1 Find inspiration and reuse
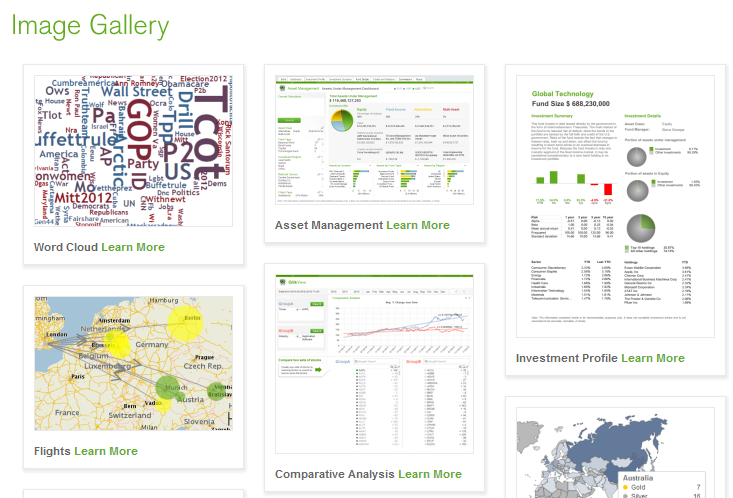
Make sure you visit QlikView Demo site prior to starting your project. One of the best things about the site is the fact that you are able to download one app and reuse the content for your own. Don’t forget to check the brand new demo image gallery with visualization highlights and samples of QlikView’s unique approach to data viz.
If you need advice on when to use which chart, take a look at Data Visualization App, it has specific information and best practices on how to show your data in the most effective ways.
2 Identify the needs
You need to understand the business process that is behind the analysis first. The more you know about the business needs the more easily you will be able to design for the business by choosing the appropriate KPIs. So your first task is to identify the KPIs for your new dashboard and assign them a relative weight so later on you will be able to use hierarchy to emphasize the heaviest, most important ones - this is key.
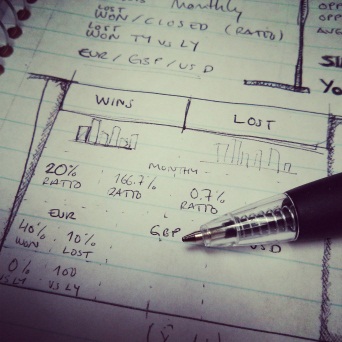
3 Use pen and paper
To create a QlikView app start by picking a piece of paper and your favorite pencil and drawing your best approach to the dashboard, you don’t need to be very specific, just sketch it out and create the basic layout to emphasize the main KPIs and comparisons that are need in your project. Don’t forget to validate your design with other users and add their feedback to your design.
4 Choose a leitmotiv
Think of the fashion designers. They base their collections on a certain decade or style and then they are consistent in applying that style to the entire collection. When working with QlikView you can be a fashion designer in a way, choose a theme, your leitmotiv for the app, and keep it in mind when creating charts and when choosing the color palette. Despite using your corporate branding, it could be a mess if you mix several colors, just keep neutral colors for backgrounds and main elements and use contrast to emphasize the most important KPIs.
Some good examples of thematic design could be founded in QlikView Developer Toolkit App, an excellent starting point for your next QlikView App, you will also find many design elements as buttons, grids, shadows and rulers and lines.
These are just some basic tips to start working with QlikView but if you want to go further in the design process to developing QlikView applications, then you should review Michael’s technical papers you will find at the bottom of his post called How To Improve Your Design Process Working With Qlikview.
Enjoy Qliking!
Arturo Muñoz
You must be a registered user to add a comment. If you've already registered, sign in. Otherwise, register and sign in.