Unlock a world of possibilities! Login now and discover the exclusive benefits awaiting you.
- Qlik Community
- :
- Blogs
- :
- Technical
- :
- Design
- :
- Using QlikView’s Report Editor
- Subscribe to RSS Feed
- Mark as New
- Mark as Read
- Bookmark
- Subscribe
- Printer Friendly Page
- Report Inappropriate Content
The visualizations and charts in QlikView are dynamic and always changing based on the user’s selections and interactions with the data. That being said I rarely find the need to print the visualizations and take them with me because I know that the data may be refreshed thus changing the visualizations and charts. But sometimes there is a need for the user to be able to print a static report of what they see in QlikView to share with someone or refer to at a later time. QlikView’s Report Editor provides users with an easy way to capture the QlikView objects in a formatted report that can printed. Reports can be created by simply dragging objects from the user interface to the report sheet.
 | 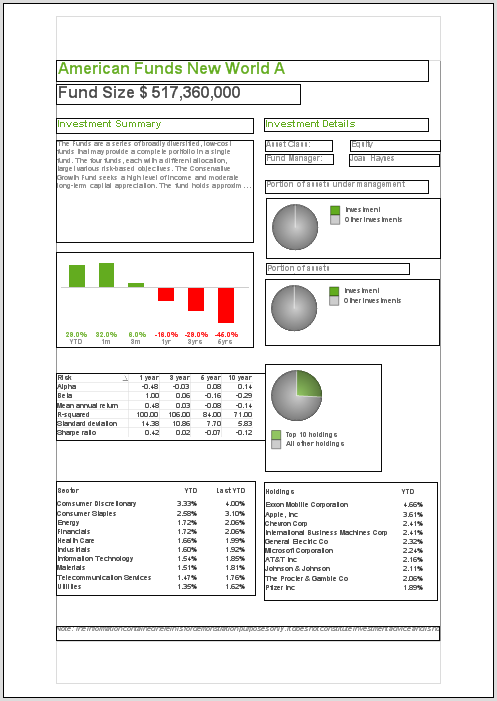 | |
| User Interface | Report sheet |
Simply drag the object from the user interface and place them anywhere on the report. Objects can be moved and resized in the report and arranged as you see fit. When I need to add objects to the report that are not a part of the user interface such as an image for the cover sheet or a logo, I will add the object to a hidden sheet in QlikView and format it as I would like it to appear in the report. Then I can drag it to the report. There is also the ability to add an image, text object or current selection box directly from the Report Editor if you prefer. In either case, static reports that are nicely formatted can be created in QlikView for users who prefer to have a printout of their visual QlikView experience.
Check out this technical brief for step-by-step details of how the reports were added to the Asset Management demo using the Report Editor.
Jennell
- « Previous
-
- 1
- 2
- 3
- 4
- 5
- Next »
You must be a registered user to add a comment. If you've already registered, sign in. Otherwise, register and sign in.