Unlock a world of possibilities! Login now and discover the exclusive benefits awaiting you.
- Subscribe to RSS Feed
- Mark as New
- Mark as Read
- Bookmark
- Subscribe
- Printer Friendly Page
- Report Inappropriate Content
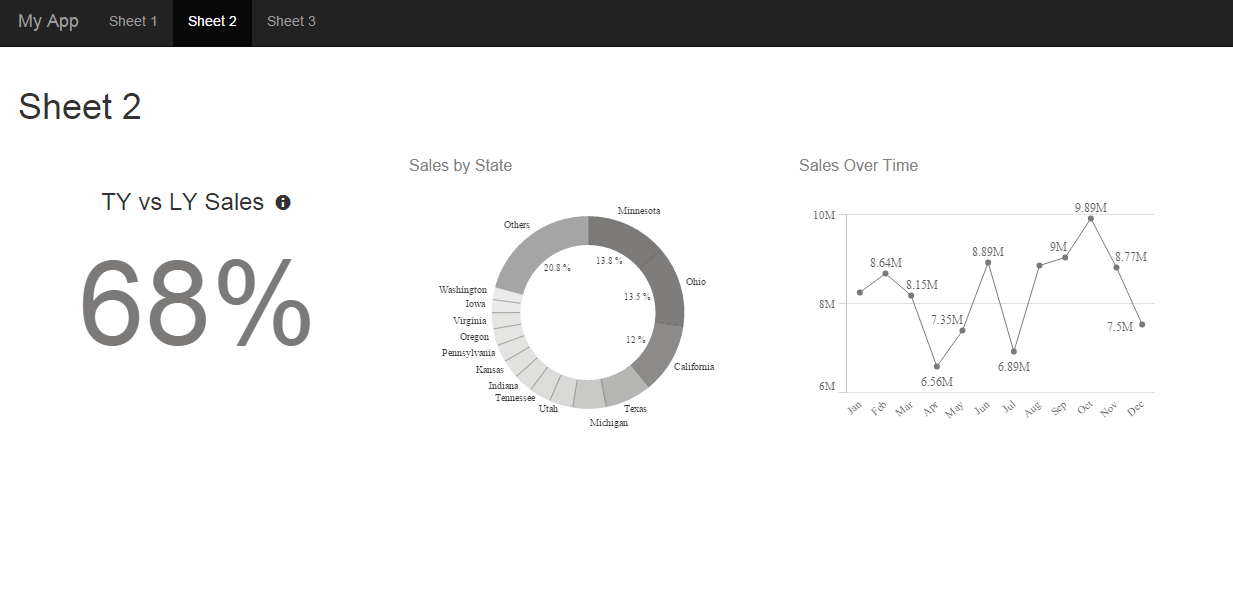
I started out writing this blog post with the intent of explaining a relatively simple technique for making sure charts display when building a mashup with tab navigation. However, it turned into a bit more. We'll go through that initial thought, in addition to installing and using a mashup template, and building a mashup using our newly installed template that's like this https://s3.amazonaws.com/demo-root/tabdemo/index.html.
Let’s start with the original intent and kind of work our way through a few topics. When building a mashup with tab navigation, any charts that render or re-render while their tab is not active end up not displaying when their tab is active. This is true of any situation in which a chart renders while its container element’s display property is none. The way to handle this is to use the qlik.resize() method when the tab is active and the chart’s container element is displayed.
I thought it would be a good idea to build a simple mashup template that implements tab navigation so you could see what I was talking about as I explained the problem above. And I did. Then I realized that it would probably be a good idea to cover how to install and use a mashup template. So let’s do that quickly.
You’ll find a .zip file attached to this post. Download it. If you're using Sense Desktop, then unzip it. Find the unzipped folder, which should be titled “bootstrap-template”. Navigate to C:\Users\{{username}}\Documents\Qlik\Sense\Extensions\Templates, and put the unzipped “bootstrap-template” folder into the templates folder. For Sense Enterprise, navigate to the QMC and click on “Extensions” in the left-bar navigation, then click “Import” and import the zipped “bootstrap-template” folder.
Once installed, navigate to the workbench. On Sense Desktop, by default this is localhost:4848/workbench, and on Sense Enterprise it’s at the \workbench subdirectory. Now that you’re at the workbench, click on “Create New,” name your mashup whatever you’d like, and from the template dropdown menu you should now see and be able to select “Basic Bootstrap Template.” Then click on the puzzle icon with the title you just gave your new mashup, and then click “Edit.”
Now you can choose an app in the upper left corner, and start dragging charts into your mashup. If you’re unfamiliar with this step, refer to https://community.qlik.com/blogs/qlikviewdesignblog/2015/05/22/creating-a-webpage-based-on-the-qlik-....
Assuming that everything went well with the installation, let’s discuss this template a bit. While I was building this template I realized that I couldn’t actually navigate tabs while in the workbench, so by default, all three (Sheet 1, Sheet 2, and Sheet 3) are displayed. This is so you can drag and drop charts into all three. Once you are done dragging charts into them, click on the .js file in the top bar, look for var tabs = false; and change it to var tabs = true;
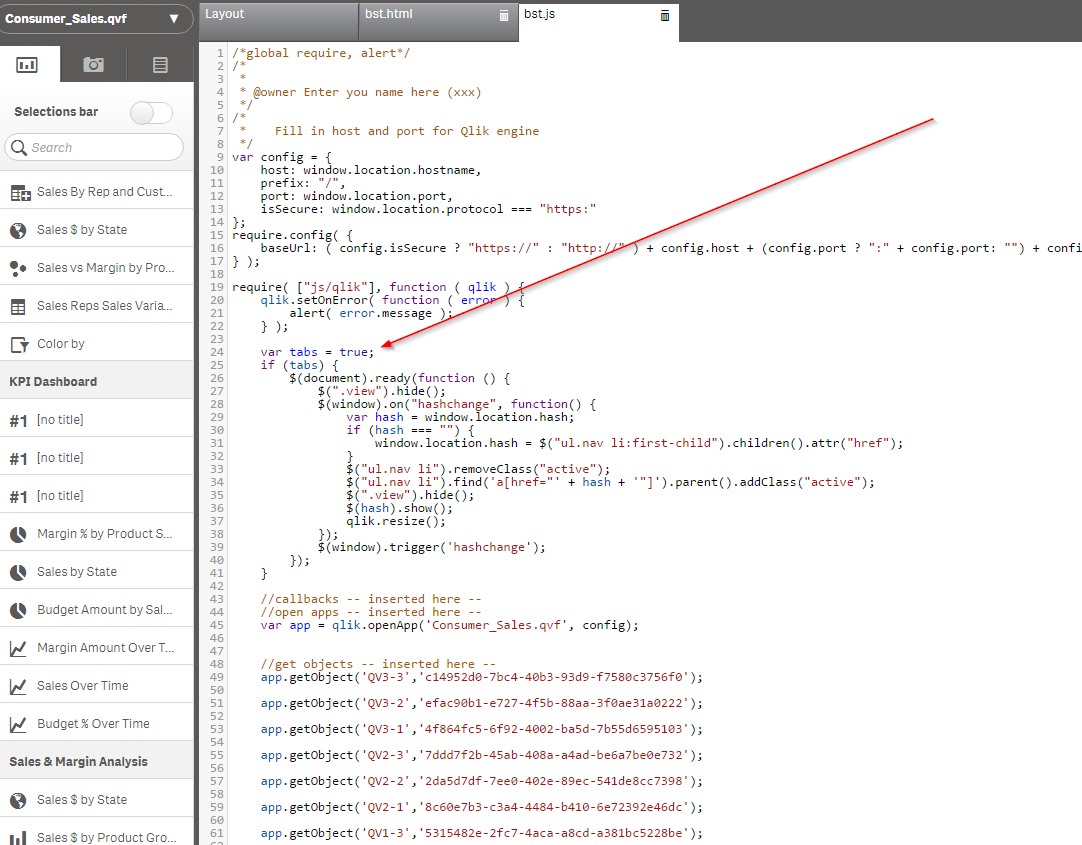
Now the tab functionality is active and you can click “View” to view your creation. If you’d like to change your charts using the Layout editor, you will have to revert that last change you made. Now you should have a mashup with tab navigation and 3 views.
Back to how this blog post started. When you switch from “Sheet 1” to “Sheet 2” or “Sheet 3”, some charts are hidden and others are displayed. Without the qlik.resize() method, the charts that were hidden when they were rendered wouldn’t display. You can test this out if you’d like by going back to the .js file and commenting out the qlik.resize() method that is being called every time you switch tabs.
If you’re not that familiar with web technologies, some of this stuff can be a little confusing, so please ask any questions you have!
- « Previous
-
- 1
- 2
- Next »
You must be a registered user to add a comment. If you've already registered, sign in. Otherwise, register and sign in.