Unlock a world of possibilities! Login now and discover the exclusive benefits awaiting you.
- Subscribe to RSS Feed
- Mark as New
- Mark as Read
- Bookmark
- Subscribe
- Printer Friendly Page
- Report Inappropriate Content
 Greetings Qlik Community. Our resident guest Blogger David Freriks is back with an interesting and innovative spin on data presentation. David is a Technology Evangelist on the Innovation and Design team at Qlik. He has been working in the "big data" space for over three years, starting with Hadoop and moving onto Spark in this continuously evolving ecosystem. He has 18+ years in the BI space, helping launch new products to market.
Natural Language Generation and Qlik Sense
How do we perceive value and how do we understand information when it is presented to us? Sometimes it is easy, many times it is not and the difference is usually based on literacy and context. The solution to accelerate understanding of data in relation to analytics can be found in simplifying charts, graphs, and visual elements into natural language or NLG (natural language generation). The simple definition of NLG is taking data and generating observations that are distilled into textual explanations.
My teammate Murray Grigo-Mcmahon has an excellent post on the nature and theory behind the concepts and design on how to approach solving data literacy, but I’m going to focus on why Qlik has been and remains a pioneer in bringing NLG into the visualization and analytics space.
Qlik has been working with Narrative Science and YSEOP since 2015 (well before analysts such as Gartner began to talk about it) to inject NLG natively into visual analytics applications and dashboards. The reason why these two NLG leading companies chose Qlik first was because of the nature of the Qlik Platform. The Qlik Indexing Engine (QIX) that powers our API’s is a unique differentiator in the BI/Analytics space as it’s the first truly open and extensible platform to encourage and support 3rd party extensions through an open source repository called Qlik Branch.
"Other vendors" may have some limited amount of 3rd party plugins now, but Qlik was first to embrace this developer Ecosystem. With well over 300 custom open source solutions (powered by Qlik and hosted on Qlik Branch) Qlik has been in a strong position to be an attractive partner to the NLG space. YSEOP and Narrative Science (NS) are the leaders in this space and we’ll focus on a use case by NS, but it’s worth pointing out each vendor has their strengths. YSEOP is unique in that is support multiple languages for their NLG.
Ok, enough about how Qlik was the first to market with NLG – let’s talk about why Qlik is a great fit for these technologies.
How about we start with an example, let’s observe this chart…
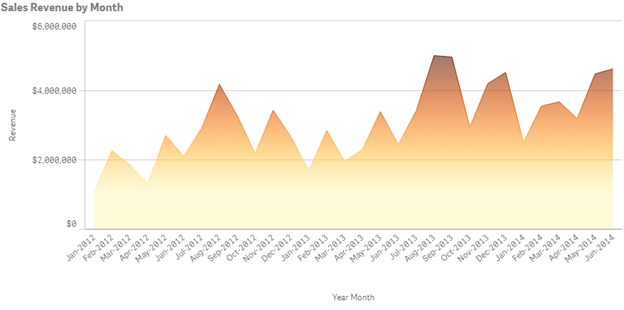
(click to enlarge)
What can we surmise?
- Revenue seems to be improving.
- Revenue is higher by $2 million dollars (ish) from Jun 2012 to Jun 2014
- There is some seasonality
Those are interesting, but lack any specifics. I would have to go create another chart or download the data to excel to calculate the specifics. This chart by itself has given me the trends (albeit, with a very pretty chart) but I haven’t actually gained any concrete knowledge.
Let’s apply Narratives for Qlik from Narrative Science to this chart.
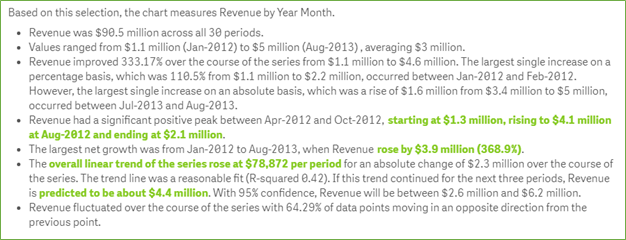
(click to enlarge)
Now, let’s analyze the results based on the NLG analysis.
- I now know total revenue over the period ($90M over 30 months)
- I know the specifics of the revenue ranges ($1.1M to $3M per month)
- Revenue improved 333% over the time analyzed, and the biggest jump between Jan 2012 to Feb 2012 by 110% and $1.1 million dollars.
- I see my peaks of revenue, I see net growth peaks
- I have a trend of $78k growth per Month over the 30 months
- I have a projection of growth to $4.4M in revenue over the next 3 months.
This is a dramatic difference in my data narrative. No more approximations, no more guesses, no need to go and create further analysis. I understand a much clearer picture, in context, of what my data is trying to tell me.
So why is Qlik so well suited for working with NLG technologies? The answer lies in our platform powered by the QIX engine. The QIX engine creates a subset of data (called a hypercube) from the overall in-memory model to stream to the NLG engine. Unlike other NLG integrations, it’s not a separate query to a database, but a leverage of the data in context being analyzed. This hypercube contains the information not only of the selections (filters) that are being applied, but by correlation the associations of the selections as well as the non-correlated values. This is quite unique, as any basic query tool can pass filters – but Qlik being able to include correlated (or uncorrelated) values provides a much richer analysis.
Imagine in the above analysis, I could also include additional data (i.e. products) and understand the relationship between products sold that contribute to the spikes in revenue and conversely the products not sold (market basket) during the negative spikes. I can truly unlock the secrets of my data as never before.
Only the Qlik platform has the power to understand all your data – and the power of NLG gives it the power to tell you why. Oh and did I tell you - Qlik was the first to have this capability? 
Regards,
David Freriks
Emerging Technology Evangelist
Follow me: David Freriks (@dlfreriks) | Twitter
You must be a registered user to add a comment. If you've already registered, sign in. Otherwise, register and sign in.