Unlock a world of possibilities! Login now and discover the exclusive benefits awaiting you.
- Qlik Community
- :
- Blogs
- :
- Technical
- :
- Design
- :
- Combo Chart extension for Qlik Sense
- Subscribe to RSS Feed
- Mark as New
- Mark as Read
- Bookmark
- Subscribe
- Printer Friendly Page
- Report Inappropriate Content
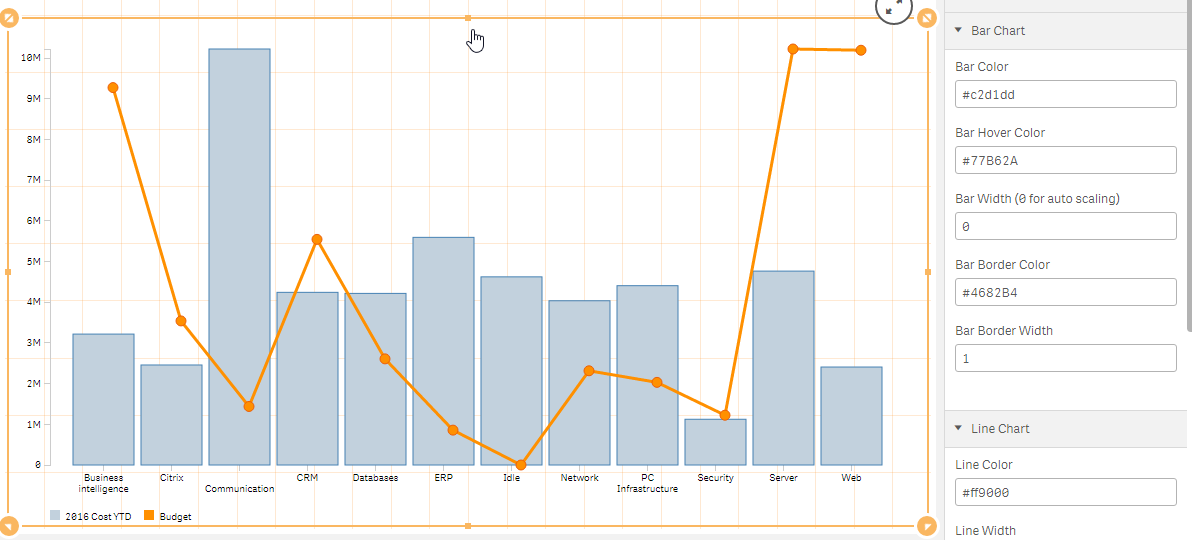
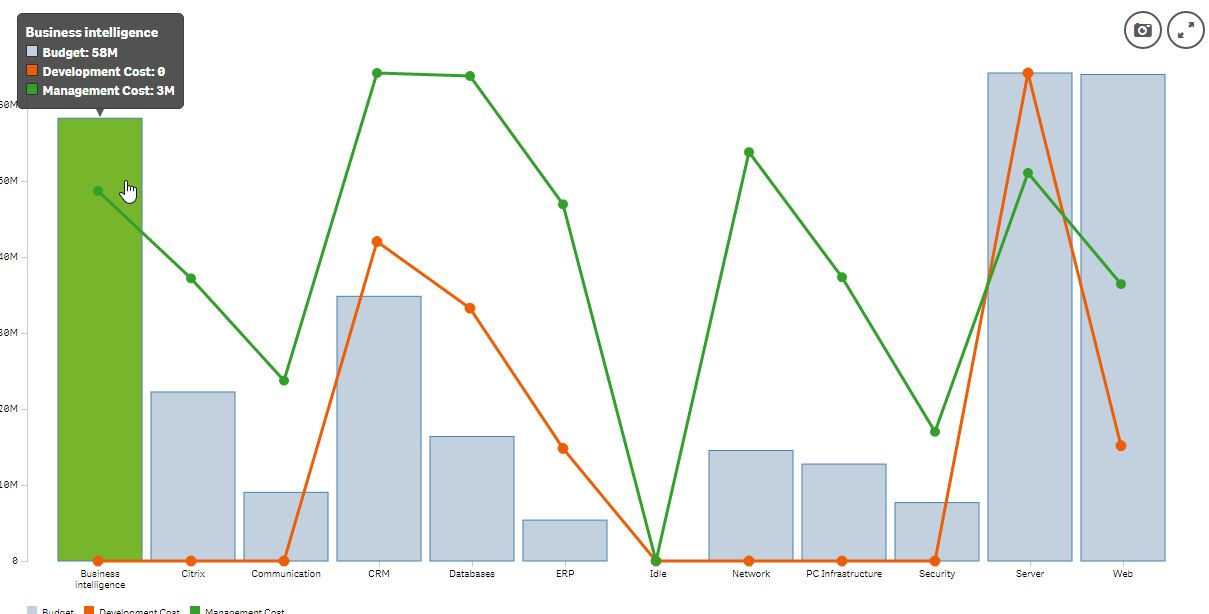
As we were working on one of our projects, we had the need of creating multiple combo charts. The problem was that we could not change the colors to match our mashup/webpage. So, I decided to make an extension, that gives full control of the chart appearance and it's labels. The same as my Barchart extension this is wrapping text labels underneath the bars. If you still have problems with the text, then just increase the width of the bars and everything should be back in place.
Installation
- [Download zip file](https://github.com/yianni-ververis/SenseUI-ComboChart/archive/master.zip)
- Desktop - Unzip at the extension folder (C:\Users\<user>\Documents\Qlik\Sense\Extensions\SenseUIComboChart)
- Server - Upload the zip file
Usage
Dimensions and Measures
- Set 1 dimension for the x Axis
- Set 1 Measure for an additional Line Chart
General Settings
- Font Size
- Font Color
- Display the Legend
- Enable/Disable Selections
Bar Chart Settings
- Bar Color
- Bar Hover Color
- Bar Width (0 for auto scaling)
- Bar Border Color
- Bar Border Width
Line Chart Settings
- Line Color
- Line Width
- Dot Color
- Dot Stroke Color
- Dot Stroke Width
- Dot Radius


Barnch: http://branch.qlik.com/#!/project/5894e07a75db504d76ac3123
Git: GitHub - yianni-ververis/SenseUI-ComboChart: Qlik Sense Combo Chart
Yianni
You must be a registered user to add a comment. If you've already registered, sign in. Otherwise, register and sign in.