Unlock a world of possibilities! Login now and discover the exclusive benefits awaiting you.
- Qlik Community
- :
- Discover
- :
- Blogs
- :
- Product
- :
- Design
- :
- My Pleasant Surprises Learning Qlik - a multi-part...
- Subscribe to RSS Feed
- Mark as New
- Mark as Read
- Bookmark
- Subscribe
- Printer Friendly Page
- Report Inappropriate Content

Coming from a traditional business intelligence and ETL background where I’ve used both proprietary and open source solutions – things like OLAP, data modeling, SQL, 4GLs, semantic layers and even coding dashboards were commonplace for many years. So when I started with Qlik, I was not only thrilled, but quite biased towards the way I manged and created analytics . As I set out to build my first Qlik application I immediately had many questions:
- Where do I build my semantic / metadata layer?
- Where is my data modeler tool to define my table relationships?
- How do I place parameters to pass where-conditions to my database?
- How do I wire my visualizations to make my dashboards interactive?
As I set out on this journey to appreciate Qlik, I was surprised at what I found. In this multi-part blog series I will share with you some of my pleasant surprises that changed the way I create and work with analytics.
So let’s dive in further to my first Qlik pleasant surprise.
#1: Where's the "Semantic Layer"?!
NOTE: The subject matter in this topic can have many moving parts and is not meant to be a direct comparison to traditional BI or other data visualization tools. It is an expression of my experiences when first working with Qlik and meant to inform those who might have similar expectations when comparing Qlik to other BI tools.
A typical first step when using BI tools is that you usually create a metadata or semantic layer before you can begin creating your reports and dashboards. Depending on the tools being used, sometimes you even need to create more than one…one layer to support operational reporting and one to support interactive OLAP. (Often when a vendor's software stack combines a number of acquired tools, you may see this occur.) Creating abstraction layers such as these are usually performed by BI administrators whom are familiar with the data. Metadata / semantic layers provide a unified, consolidated view of data across the organization. They are important middlemen that connect back-end data to BI client tools and add a layer of governance and security. These centralized repositories store many attributes of your data including specific attributes used by the tools:
- Connection information
- Business friendly field names
- Field and row-level security
- Aggregations
- Data modeling properties such as keys, and referential integrity
- Calculated expressions
Once a semantic layer is prepared, the BI client tools can begin using the "data models", "business objects", "data dictionary" etc, to create reports and dashboards.
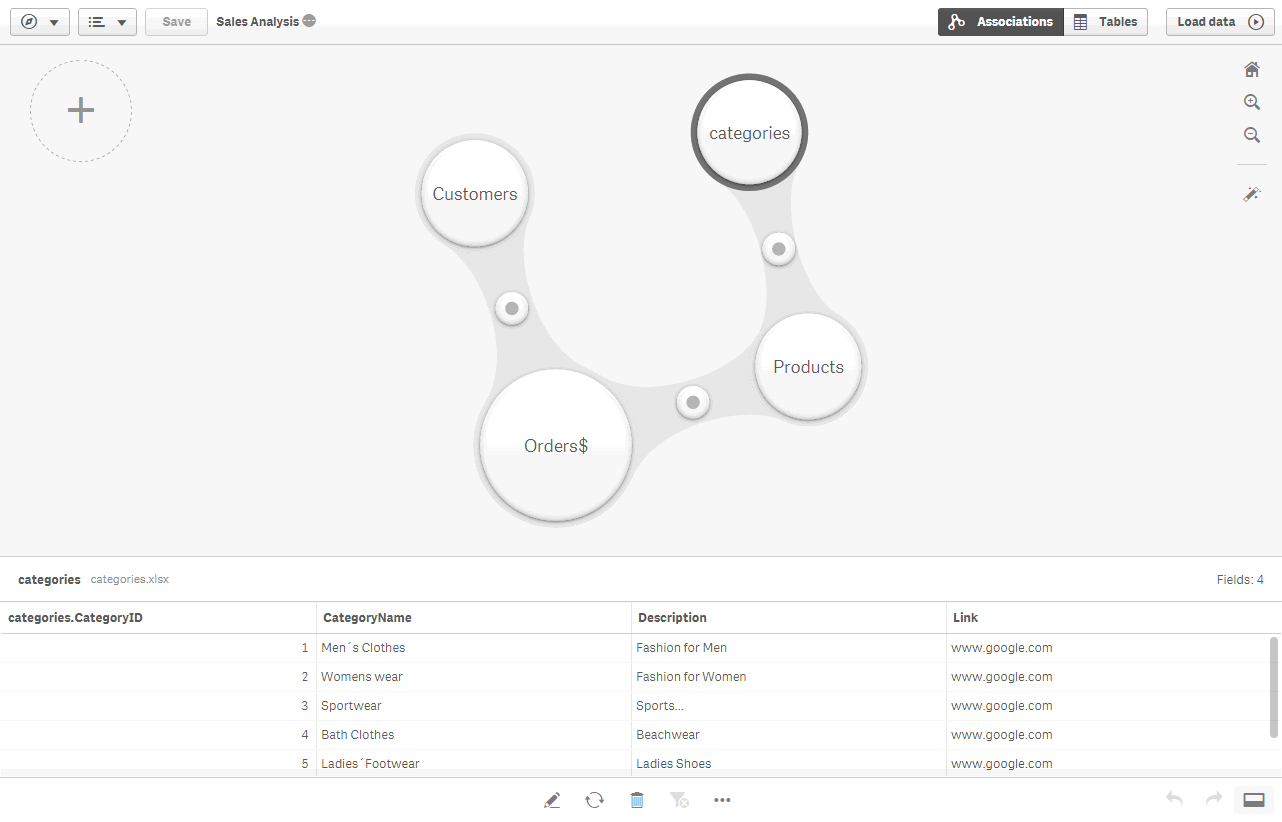
Now, when I started working with Qlik, I was unsure how this step was performed -OR- perhaps what I was doing seemed more transparent and less rigid than what I was used to. For starters I could quickly load data directly from many sources and go directly into my analysis. Qlik simply loads and indexes data into its apps during the app creation. These apps then operate within an associative indexing engine. (more on that in another article) - If I wanted to add multiple sources, I can visually profile the data and define relationships automatically - no complex data modeling or SQL required. I did not need to worry if I was "joining" correctly or even understand the relationships of the tables. I found this to be a huge time-saver and the process was fairly simple to navigate. This was indeed a pleasant surprise.
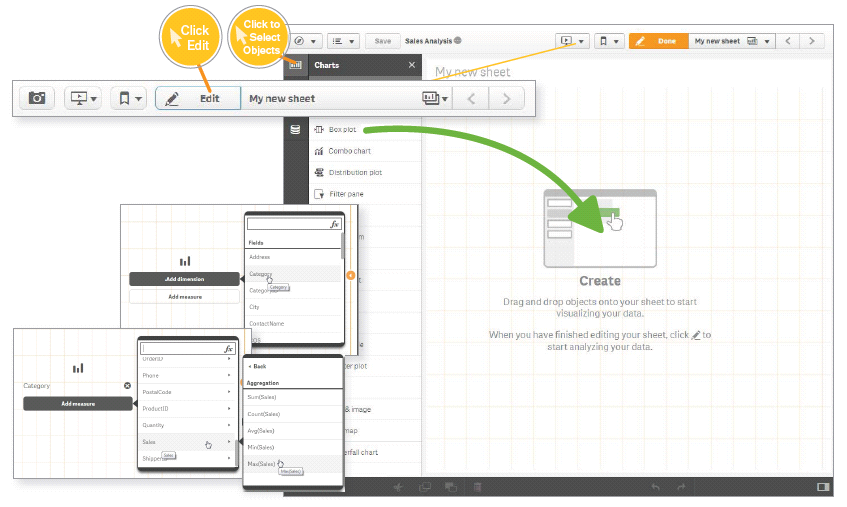
Once the data was loaded into the app, I immediately had access to my fields and could begin creating my analysis. In addition, I discovered that I can also set up reusable expressions, measures, dimensions and even predefined visualizations, through a feature known as Master Items. Master Items are defined in the Qlik Sense App rather than a centralized server. They allow business users to use a pre-defined library of assets so they can easily create and customize visualizations. (Note: Master Items are more beneficial to users of Qlik Sense Enterprise as opposed to those using Qlik Sense Desktop.)
This was a pleasant surprise as it was extremely easy to get started with Qlik and cut my data preparation time significantly, in turn giving me more time to create my analysis.So basically, I discovered that Qlik, defines its "semantic layer" within the app itself, as opposed to a separate repository?!? Hmmm.....
A healthy debate ensues
To some degree, I understand there are some opinions about this approach, and some may say "That's not a semantic layer". Now there are ways that you can export a Qlik data model and data index, created within the app, to disk (.qvd) and use them with other applications. This has been done widely and successfully by many of our customers. But...with the new Master Items approach introduced in Qlik Sense, we needed a way to centralized those assets for other applications as well, so our team of experts have created a Qlik Powertool, the Governed Metrics Service.
"The Governed Metrics Service (GMS) Powertool provides the ability to control and provision the use of governed Master Items. GMS loads externally defined metrics and applies them to one or more designated applications. GMS will quickly have you on the right track to governed self-service."
To learn more about GMS check it out here: Introduction - EA Powertools Governed Metrics Service
My journey with Qlik is no where near completed and I anticipated many more pleasant surprises. Next week I'll cover another pleasant Qlik surprise that helped me uncover things in my data I had not idea existed. Have a comment or question, a pleasant surprise you want to share? We want to hear from you. Use the comments section below to ask a question and join the discussion.
Regards,
Michael Tarallo (@mtarallo) | Twitter
Qlik
For starters, if you are a visual learner and new to Qlik, take a look at this brief video to get an idea of how to provision from multiple tables using Qlik Sense:
NOTE: To increase resolution or size of the video, select the YouTube logo at the bottom right of the player. You will be brought directly to YouTube where you can increase the resolution and size of the player window. Look for the 'settings' gears icon in the lower right of the player once at YouTube. (video and sample files)
For more videos that can help you get started with Qlik Sense:
You must be a registered user to add a comment. If you've already registered, sign in. Otherwise, register and sign in.