Unlock a world of possibilities! Login now and discover the exclusive benefits awaiting you.
Employee
2018-03-30
08:28 PM
- Subscribe to RSS Feed
- Mark as New
- Mark as Read
- Bookmark
- Subscribe
- Printer Friendly Page
- Report Inappropriate Content
We have been adding more features to our qdt-components and some of these, are the latest Picasso.js charts.
Here are the charts that we have so far.
Also you can interact with them live on our react template, https://webapps.qlik.com/qdt-components/react/index.html
- You can Embed any object from Qlik Sense and the Capability API
- You can create any custom Session object by defining your own definition properties like dimension, measures, title, subtitle, color, order etc
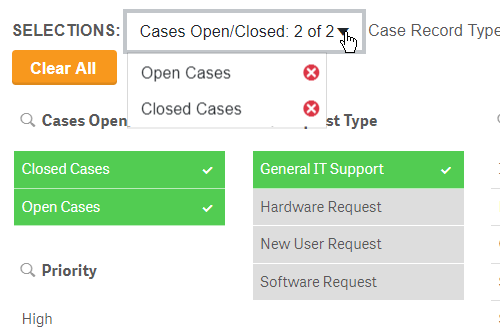
- There is a custom Selection Toolbar that we use extensively in our mashups
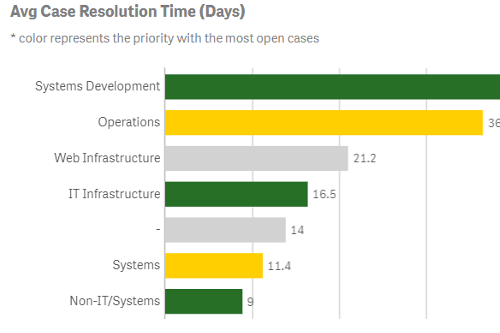
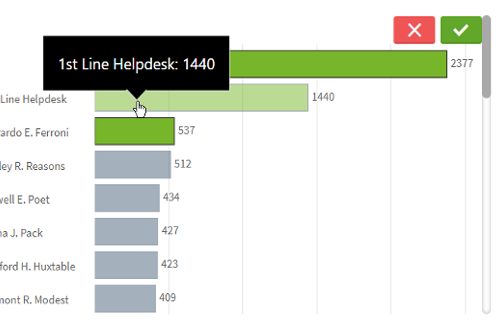
- A Picasso Horizontal bar that detects the height of the div. Once The bars exceed that, it adds a scrollbar. It also features multiple selections and tooltip
- The same idea but with vertical bars

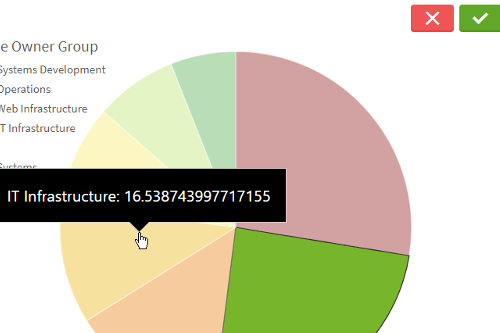
- A new Picasso Pie Chart with Legend, multiple selections and tooltip
- A new Scotterplot with multiple selections, tooltip and legend
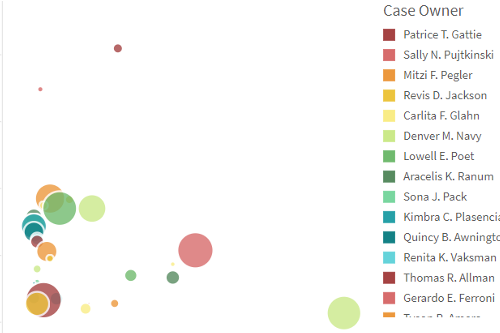
- And now the latest addition, scotterplot with custom images

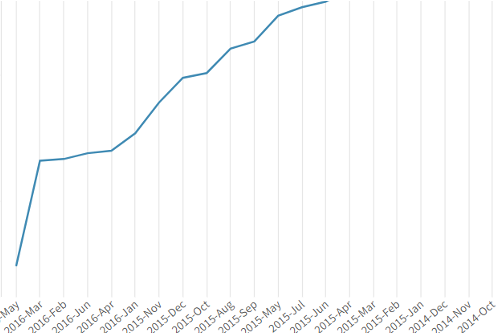
- A simple line chart
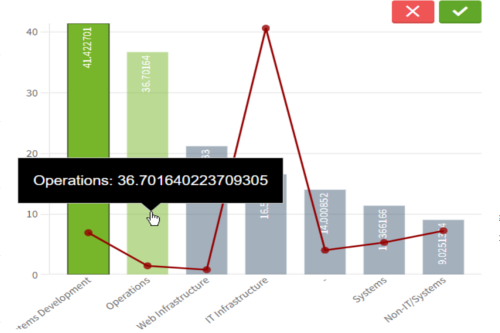
10. Combo chart
More are coming soon with this amazing library!!!!
Yianni
Labels
11 Comments
- « Previous
-
- 1
- 2
- Next »
You must be a registered user to add a comment. If you've already registered, sign in. Otherwise, register and sign in.