Announcements
Qlik Connect 2024! Seize endless possibilities! LEARN MORE

How to Insert Chart Titles in Templates

cancel
Showing results for 
Search instead for 
Did you mean: 
Bjorn_Wedbratt
Former Employee
Former Employee

How to Insert Chart Titles in Templates

Last Update:

Nov 24, 2015 8:56:16 AM

Updated By:

Bjorn_Wedbratt

Created date:

Nov 24, 2015 8:56:16 AM

Add a Title

                    
     Add-a-Title.png                           
          

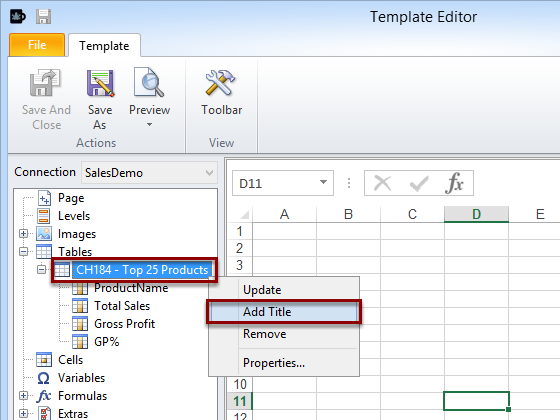
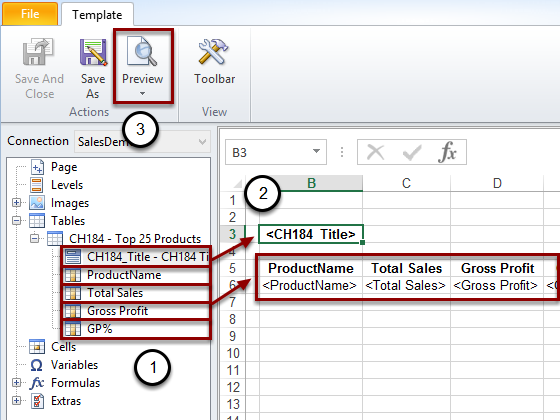
After you have added a QlikView object as a table:

  1. Right click on the table node
  2. Select Add Title

NOTE: You can add the title tag in levels, charts and images using the MS Office Template Editors. The PixelPerfect template editor does not support the Chart Title tag for images.


Generate Preview

                    
            Generate-Preview.png                    
          
  1. Drag and drop the CH184
  2. Drag and drop the CH184_Title
  3. Click on Preview


Result

                    
            Result.png                    
          

The resulting Excel report should look like this.


Comments
Not applicable

Great stuff, thanks for posting.

Can you also expand on this posting to address how to add an object title for an image in an nprinting powerpoint report?

Thanks

Version history
Last update:
‎2015-11-24 08:56 AM
Updated by: