Unlock a world of possibilities! Login now and discover the exclusive benefits awaiting you.
- Qlik Community
- :
- All Forums
- :
- QlikView App Dev
- :
- Re: Set analysis expression as dynamic max in line...
- Subscribe to RSS Feed
- Mark Topic as New
- Mark Topic as Read
- Float this Topic for Current User
- Bookmark
- Subscribe
- Mute
- Printer Friendly Page
- Mark as New
- Bookmark
- Subscribe
- Mute
- Subscribe to RSS Feed
- Permalink
- Report Inappropriate Content
Set analysis expression as dynamic max in line graph?!?
Hi all,
In my line graph I plot according to this expression:
sum ({1<[Schadecategorie] = {'A','B','C','D','E','F','G','H'}>} [Reserve bedrag in €] / 1000000)
I thought that a clever way of making sure the graph would always display properly, was making use of this expression:
max(aggr(sum({1 <[Schadecategorie] = {'A','B','C','D','E','F','G','H'}>}[Reserve bedrag in €] / 1000000),Peildatum))
But for some reason, the line goes above (and out of) the chart. Dimension in this chart is Peildatum.
When I add 4.5 mln. to the max() expression, it's OK. What am I doing wrong?
- Mark as New
- Bookmark
- Subscribe
- Mute
- Subscribe to RSS Feed
- Permalink
- Report Inappropriate Content
Invited you to connect... Also mentioned my mail addy (rather cryptically, as LI forbids it..  )
)
- Mark as New
- Bookmark
- Subscribe
- Mute
- Subscribe to RSS Feed
- Permalink
- Report Inappropriate Content
I'm afraid I don't see anything wrong. It seems to work just fine. Grafiek IBNR with 2015 and Totaal selected:
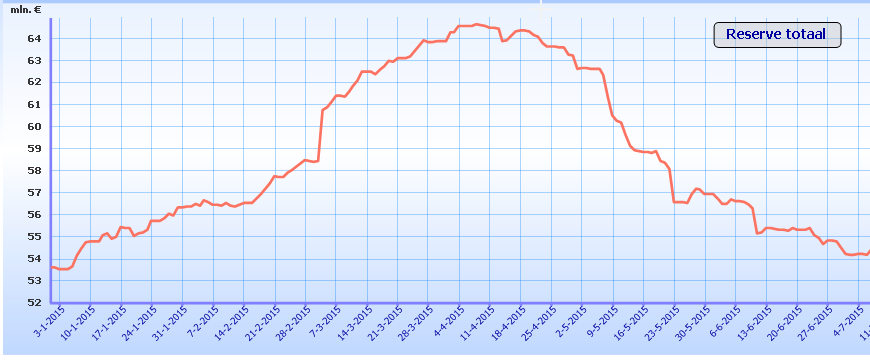
Your expression for the max returns 64,94 and that works fine as max axis value for the chart.
talk is cheap, supply exceeds demand
- Mark as New
- Bookmark
- Subscribe
- Mute
- Subscribe to RSS Feed
- Permalink
- Report Inappropriate Content
That is true, but that is the one in which I added 4.5 miliion:
max(aggr(sum({1 <[Schadecategorie] = {'A','B','C','D','E','F','G','H'}>}[Reserve bedrag in €] / 1000000),Peildatum)) + 4.5
Seems rather silly to be adding a constant to an expression, just to make it 'fit', if you catch my drift...
- Mark as New
- Bookmark
- Subscribe
- Mute
- Subscribe to RSS Feed
- Permalink
- Report Inappropriate Content
Ok, I see what the problem is. You're messing around with min and max settings for the x-axis.  The chart actually contains more data, but doesn't show it. And you're using {1} in your expressions to overrule the selections of Peildatum and Peiljaar. That needs to be added to the expression to calculate the max value for the y-axis:
=max({<Peildatum, Peiljaar={$(vPeiljaar)}>}aggr(
sum({1 <[Schadecategorie] = {'A','B','C','D','E','F','G','H'}>}[Reserve bedrag in €] / 1000000)
,Peildatum))
talk is cheap, supply exceeds demand
- Mark as New
- Bookmark
- Subscribe
- Mute
- Subscribe to RSS Feed
- Permalink
- Report Inappropriate Content
Brilliant!! That did the trick! And - what's more important - I see your point! Thanks, Gysbert for taking the trouble for helping me out this way!!
- Mark as New
- Bookmark
- Subscribe
- Mute
- Subscribe to RSS Feed
- Permalink
- Report Inappropriate Content
One more thing - I tried the same min/max thing on the chart in "Grafiek Reserve", which is a continuously shifting graph, showing the reserve for the last 365 days.. So again, I was messing about with the X-axis.. Your solution didn't work there, because vPeiljaar is not an issue there.. Any ideas on how this one should be tackled?
- Mark as New
- Bookmark
- Subscribe
- Mute
- Subscribe to RSS Feed
- Permalink
- Report Inappropriate Content
You have records where Peildatum is null. You can check this by making a copy of the chart and change the chart type to a Straight Table chart. Then sort that table by Reserve in descending order.
To get the maximum that excludes the null Peildatum you can use this expression:
max({<Peildatum={'*'}>}aggr(sum({1<[Schadecategorie] = {'A','B','C','D','E','F','G','H'}>}[Reserve bedrag in €] / $(vDivideFactor)),Peildatum))
talk is cheap, supply exceeds demand
- Mark as New
- Bookmark
- Subscribe
- Mute
- Subscribe to RSS Feed
- Permalink
- Report Inappropriate Content
OK, going to try that.. Shouldn't I rather try to fix this in the load script? As you can see I used IntervalMatch() (to be honest, for the first time) and I suspect I might have done something wrong there..
- Mark as New
- Bookmark
- Subscribe
- Mute
- Subscribe to RSS Feed
- Permalink
- Report Inappropriate Content
Yes, there is indeed one NULL value for Peildatum; reserve there is 124,39 (far too high)... I haven't a clue how this happened, to be honest..
- Mark as New
- Bookmark
- Subscribe
- Mute
- Subscribe to RSS Feed
- Permalink
- Report Inappropriate Content
You have a number of records where the Startdatum and Einddatum have the same date (just different times). Those won't be matched with the intervalmatch. That's because the Peildatum values don't have a time fraction. So the Peildatum that you'd expect to be matched is earlier than the Startdatum of the same day, i.e. Peildatum 26-03-2016 00:00:00 lies before the interval of Startdatum 26-03-2016 18:48:17 and Einddatum 2016-03-22 18:49:57.
talk is cheap, supply exceeds demand