Unlock a world of possibilities! Login now and discover the exclusive benefits awaiting you.
- Qlik Community
- :
- Forums
- :
- Analytics
- :
- New to Qlik Analytics
- :
- Re: KPI using 2 measures
- Subscribe to RSS Feed
- Mark Topic as New
- Mark Topic as Read
- Float this Topic for Current User
- Bookmark
- Subscribe
- Mute
- Printer Friendly Page
- Mark as New
- Bookmark
- Subscribe
- Mute
- Subscribe to RSS Feed
- Permalink
- Report Inappropriate Content
KPI using 2 measures
Hi! I'm a newbie and can use some help. I'm trying to add a KPI chart that shows 'Current Period's Expenses' as the leading measure and I want to add a 2nd measure reflecting the % to Plan. I imagine I should be able to do some formatting to make it obvious as to whether it was favorable or unfavorable to plan. I can not get the 2nd measure to calculate. Any suggestions???
- Tags:
- kpi's calculation
- Mark as New
- Bookmark
- Subscribe
- Mute
- Subscribe to RSS Feed
- Permalink
- Report Inappropriate Content
I guess what does your data look like? Have you tried something thus far? Is there a sample you can provide?
- Mark as New
- Bookmark
- Subscribe
- Mute
- Subscribe to RSS Feed
- Permalink
- Report Inappropriate Content
Loved to share, but don't know how... Trying to figure it out
- Mark as New
- Bookmark
- Subscribe
- Mute
- Subscribe to RSS Feed
- Permalink
- Report Inappropriate Content
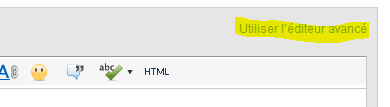
top right --> advanced editor
bottom right --> attach
- Mark as New
- Bookmark
- Subscribe
- Mute
- Subscribe to RSS Feed
- Permalink
- Report Inappropriate Content
I don't see this option in the top corner... I guess that's the pain of being new. Thanks!
- Mark as New
- Bookmark
- Subscribe
- Mute
- Subscribe to RSS Feed
- Permalink
- Report Inappropriate Content
Check here, just tried helping somebody with the same thing with some screenshots on how to attach a sample
- Mark as New
- Bookmark
- Subscribe
- Mute
- Subscribe to RSS Feed
- Permalink
- Report Inappropriate Content
Hi Peggy
in your post , clik on modify then in the right top corner clic on advance editor :
then in the bottom right clic on join to upload sample file or app.

For a KPI object in qlik Sense you can add 2 mesures so it appear like that for example
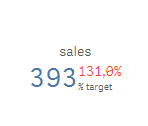
first mesure is Sales
second mesure is % of sales
You can choose color for both and conditional color regarding of the results
So for you I guess you have both current period expense and target mesure.
first mesure sum(expense)
second would be sum(expense) / sum(target) format is number and rendre as %
hope it helps
Bruno
- Mark as New
- Bookmark
- Subscribe
- Mute
- Subscribe to RSS Feed
- Permalink
- Report Inappropriate Content
Hi Peggy,
The second measure in a KPI will be displayed as a small figure right next to the main measure. Mostly for a comparison with the first measure.
Thanks,
Sangram.