Unlock a world of possibilities! Login now and discover the exclusive benefits awaiting you.
- Qlik Community
- :
- All Forums
- :
- QlikView App Dev
- :
- Re: Percentage of the total with two dimensions cr...
- Subscribe to RSS Feed
- Mark Topic as New
- Mark Topic as Read
- Float this Topic for Current User
- Bookmark
- Subscribe
- Mute
- Printer Friendly Page
- Mark as New
- Bookmark
- Subscribe
- Mute
- Subscribe to RSS Feed
- Permalink
- Report Inappropriate Content
Percentage of the total with two dimensions crossing
Hi everyone,
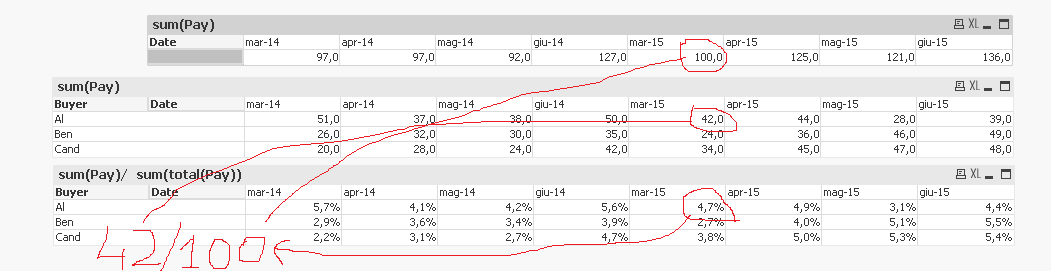
what I'm looking for is to display the percentage of the total with two dimensions crossing.
What I would like is to have the % of Pay of the total of Pay per Data crossed per Buyer.
I tried but does not work...
Then what I would like to do is to compare the value of month-year (mar-15) with the month-year before (mar-14) and display it in mar-15 and don't display anymore mar-14. This for every month-year of 15. No display month-year of 14.
The example down there.
Is that clear enough?
Here attached my qvw.
Thank you all.
Filiberto
- « Previous Replies
-
- 1
- 2
- Next Replies »
Accepted Solutions
- Mark as New
- Bookmark
- Subscribe
- Mute
- Subscribe to RSS Feed
- Permalink
- Report Inappropriate Content
- Mark as New
- Bookmark
- Subscribe
- Mute
- Subscribe to RSS Feed
- Permalink
- Report Inappropriate Content
May be this:
Sum(Pay)/Sum(TOTAL <Date>Pay)

- Mark as New
- Bookmark
- Subscribe
- Mute
- Subscribe to RSS Feed
- Permalink
- Report Inappropriate Content
For your first request, try TOTAL qualifier with field list:
sum(Pay)/ sum(total<Date>(Pay))
- Mark as New
- Bookmark
- Subscribe
- Mute
- Subscribe to RSS Feed
- Permalink
- Report Inappropriate Content
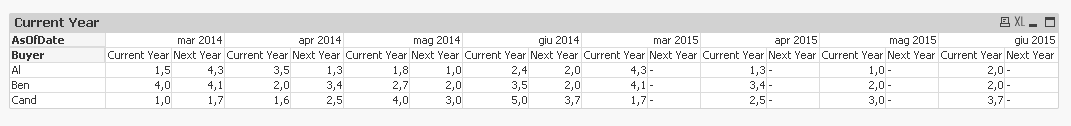
For your second request, look into the concept of an AsOf table:
- Mark as New
- Bookmark
- Subscribe
- Mute
- Subscribe to RSS Feed
- Permalink
- Report Inappropriate Content
Something like this for your second requirement?
- Mark as New
- Bookmark
- Subscribe
- Mute
- Subscribe to RSS Feed
- Permalink
- Report Inappropriate Content
Hi guys sunindia and swuehl, what if I want to display in the MonthYear-n, the sum of MonthYear-n+1 ; MonthYear-n+2 ; MonthYear-n+23.
What I should do?
I tried with this one but doesn't work....
Sum(aggr(rangesum(below(total sum({<Flag ={'CY'} >} Pay),1,3)),AsOfDate,Buyer))

I think that my problem is that I have to consider 2 dimensions.
I don't if I'm clear enough with my explanation.
Here my new qvw.
Thanks.
Filiberto !
What do you think gwassenaar?
- Mark as New
- Bookmark
- Subscribe
- Mute
- Subscribe to RSS Feed
- Permalink
- Report Inappropriate Content
I am not sure I understand completely. Would it be possible to export this chart into Excel and replace the expected number using Excel formulas?
- Mark as New
- Bookmark
- Subscribe
- Mute
- Subscribe to RSS Feed
- Permalink
- Report Inappropriate Content
Yes. Attached here.
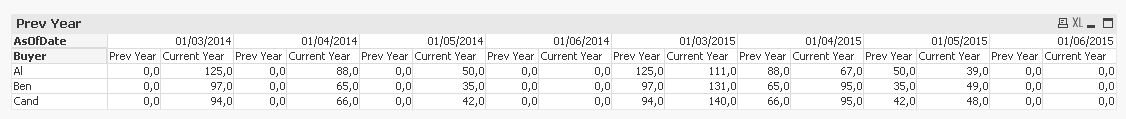
As u can see CY is the sum of the next 3 months and PY is the sum of the next 3 months of the PY.
Can you better understand now?
thx so much
- Mark as New
- Bookmark
- Subscribe
- Mute
- Subscribe to RSS Feed
- Permalink
- Report Inappropriate Content
Some scripts modifications were required, but it seems to work now
Script:
TABLE_TEMP:
LOAD * INLINE [
Date, Buyer, Pay, Day, CAT
01/03/2014, Cand, 10, 1, Open
01/04/2014, Ben, 21, 2, Closed
01/05/2014, Cand, 12, 4, Open
01/06/2014, Ben, 22, 5, Closed
01/03/2015, Ben, 10, 7, Open
01/04/2015, Ben, 21, 3, Closed
01/05/2015, Al, 12, 1, Open
01/06/2015, Al, 22, 2, Closed
01/03/2014, Ben, 8, 4, Open
01/04/2014, Cand, 9, 3, Closed
01/05/2014, Ben, 10, 4, Open
01/06/2014, Cand, 21, 6, Closed
01/03/2015, Cand, 12, 3, Open
01/04/2015, Cand, 22, 3, Closed
01/05/2015, Cand, 23, 2, Open
01/06/2015, Ben, 24, 3, Open
01/03/2014, Al, 25, 1, Open
01/04/2014, Al, 10, 2, Open
01/05/2014, Al, 10, 4, Open
01/06/2014, Al, 21, 3, Open
01/03/2015, Al, 12, 5, Open
01/04/2015, Al, 13, 2, Open
01/05/2015, Ben, 14, 2, Open
01/06/2015, Cand, 15, 3, Open
01/03/2014, Cand, 10, 1, Open
01/04/2014, Ben, 11, 2, Open
01/05/2014, Cand, 12, 4, Open
01/06/2014, Ben, 13, 1, Open
01/03/2015, Ben, 14, 2, Open
01/04/2015, Ben, 15, 4, Open
01/05/2015, Al, 16, 1, Open
01/06/2015, Al, 17, 2, Open
01/03/2014, Ben, 18, 4, Open
01/04/2014, Cand, 19, 1, Open
01/05/2014, Ben, 20, 2, Closed
01/06/2014, Cand, 21, 4, Closed
01/03/2015, Cand, 22, 1, Closed
01/04/2015, Cand, 23, 2, Closed
01/05/2015, Cand, 24, 4, Closed
01/06/2015, Ben, 25, 1, Closed
01/03/2014, Al, 26, 2, Closed
01/04/2014, Al, 27, 4, Closed
01/05/2014, Al, 28, 1, Closed
01/06/2014, Al, 29, 2, Closed
01/03/2015, Al, 30, 4, Closed
01/04/2015, Al, 31, 1, Closed
01/05/2015, Ben, 32, 2, Closed
01/06/2015, Cand, 33, 4, Closed
];
TABLE:
LOAD Buyer,
Pay,
Day,
CAT,
Date,
AutoNumber(Num(Month(Date))) - 1 as MonthNum
Resident TABLE_TEMP
Order By Date desc;
DROP Table TABLE_TEMP;
AsOf:
LOAD Date as AsOfDate,
Date,
'CY' as FlagYear
Resident TABLE;
Concatenate (AsOf)
LOAD Date as AsOfDate,
Date#( AddYears(Date, -1),'DD/MM/YYYY') as Date,
'PY' as FlagYear
Resident TABLE;
Expressions
1) Previous Year: RangeSum(After(Sum({<FlagYear = {'PY'}>}Pay), 1, MonthNum))
2) Current Year: RangeSum(After(Sum({<FlagYear = {'CY'}>}Pay), 1, MonthNum))
- Mark as New
- Bookmark
- Subscribe
- Mute
- Subscribe to RSS Feed
- Permalink
- Report Inappropriate Content
That's helps, but is not exactly what I was looking for.
In this case if I add a MonthYear in the loading data, like a new month 01/07/2015, I see in the CY 01/03/2105 value the sum of the next 4 months that exists. I want the sum of the next 3 months and not of all the next existing months.
Enough clear?
Here attached my new qvw.
Thank u so much.
Filiberto
- « Previous Replies
-
- 1
- 2
- Next Replies »