Unlock a world of possibilities! Login now and discover the exclusive benefits awaiting you.
- Qlik Community
- :
- All Forums
- :
- QlikView App Dev
- :
- Re: How to: Recent seven days by the selected day
- Subscribe to RSS Feed
- Mark Topic as New
- Mark Topic as Read
- Float this Topic for Current User
- Bookmark
- Subscribe
- Mute
- Printer Friendly Page
- Mark as New
- Bookmark
- Subscribe
- Mute
- Subscribe to RSS Feed
- Permalink
- Report Inappropriate Content
How to: Recent seven days by the selected day
I need to show last seven days according to the selected day.
how to do it?
Thanks
- « Previous Replies
-
- 1
- 2
- Next Replies »
- Mark as New
- Bookmark
- Subscribe
- Mute
- Subscribe to RSS Feed
- Permalink
- Report Inappropriate Content
hi
Try like this
Date:
LOAD * INLINE [
Day, Value
01/01/2016, 10
02/01/2016, 20
03/01/2016, 30
04/01/2016, 40
05/01/2016, 50
06/01/2016, 60
07/01/2016, 70
08/01/2016, 80
09/01/2016, 90
10/01/2016, 10
];
Add a variable vMaxDate :=Date(Max(Date(Day))-7) /* MaxDate*/
Sum({<Day={"$(vMaxDate)"}>}Value)
- Mark as New
- Bookmark
- Subscribe
- Mute
- Subscribe to RSS Feed
- Permalink
- Report Inappropriate Content
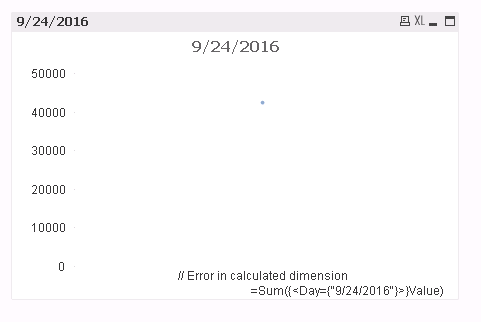
Thanks, attached screen shots.
Please check, what i did wrong?

- Mark as New
- Bookmark
- Subscribe
- Mute
- Subscribe to RSS Feed
- Permalink
- Report Inappropriate Content
Select the Date you want and make sure that Date field is in proper Date format, use below expression
=sum({<Date ={">=$(=date(max(Date)-6))<=$(=max(Date))"}>}Amount)
- Mark as New
- Bookmark
- Subscribe
- Mute
- Subscribe to RSS Feed
- Permalink
- Report Inappropriate Content
Hi Kush141087,
thanks for your help.
I did what you are wrote, please see below. what i did wrong?
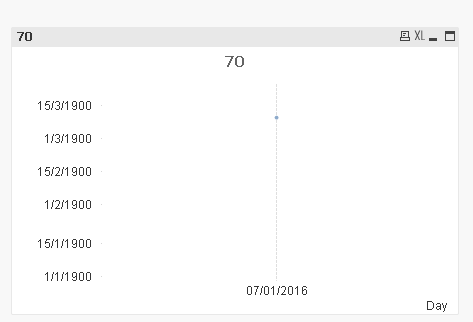
Thanks
Ariel
- Mark as New
- Bookmark
- Subscribe
- Mute
- Subscribe to RSS Feed
- Permalink
- Report Inappropriate Content
Add it in the Expression tab
Sum({<Day={"$(vMaxDate)"}>}Value).
- Mark as New
- Bookmark
- Subscribe
- Mute
- Subscribe to RSS Feed
- Permalink
- Report Inappropriate Content
What is the Dimension & Expression you are using? If date is dimension then try below expression
=sum(aggr(rangesum(above(total sum({<Date=>}Amount),0,7)),Date))
- Mark as New
- Bookmark
- Subscribe
- Mute
- Subscribe to RSS Feed
- Permalink
- Report Inappropriate Content
Hi,
This is my data:
TimeSelection:
LOAD * INLINE [
Period, dayS
Day, 1
Week, 7
Month, 30
Quarter, 91
HalfYear, 183
Year, 365
];
Time:
LOAD * INLINE [
Day, Value
01/01/2016, 10
02/01/2016, 20
03/01/2016, 30
04/01/2016, 40
05/01/2016, 50
06/01/2016, 60
07/01/2016, 70
08/01/2016, 80
09/01/2016, 90
10/01/2016, 10
];
I need to create Fit XY. x=value, y= Day.
I want to choose day and Period and i want to see in the graph the day and all the period before the day.
Example:
I want to see week before 09/01/2016:
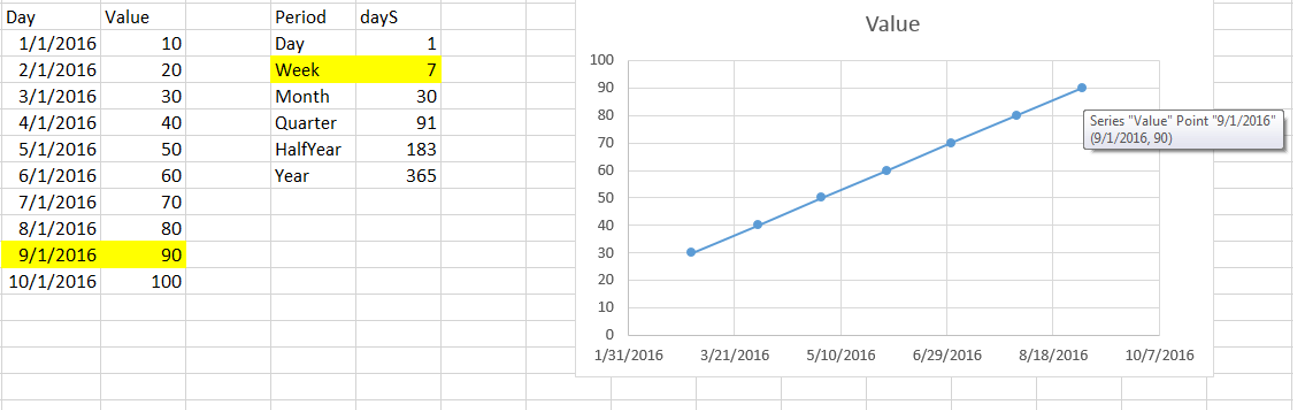
Thanks
Ariel
- Mark as New
- Bookmark
- Subscribe
- Mute
- Subscribe to RSS Feed
- Permalink
- Report Inappropriate Content
select Line chart than
Take Date as dimension
and
=sum({<Day={">=$(=Date(Max(Day)-6))<=$(=Date(Max(Day)))"}>} Money) as Expression
- « Previous Replies
-
- 1
- 2
- Next Replies »