Unlock a world of possibilities! Login now and discover the exclusive benefits awaiting you.
- Qlik Community
- :
- All Forums
- :
- QlikView App Dev
- :
- Re: Layout issue in qlikview pivot
- Subscribe to RSS Feed
- Mark Topic as New
- Mark Topic as Read
- Float this Topic for Current User
- Bookmark
- Subscribe
- Mute
- Printer Friendly Page
- Mark as New
- Bookmark
- Subscribe
- Mute
- Subscribe to RSS Feed
- Permalink
- Report Inappropriate Content
Layout issue in qlikview pivot
Hi,
It will be great help to me if somebody help me sort this issue.
In qlikview pivot, one can adjust the expression layout based on dragging it at column level or row level,
But in depends on type of data. But i need some help to adjust the layout.
Background :
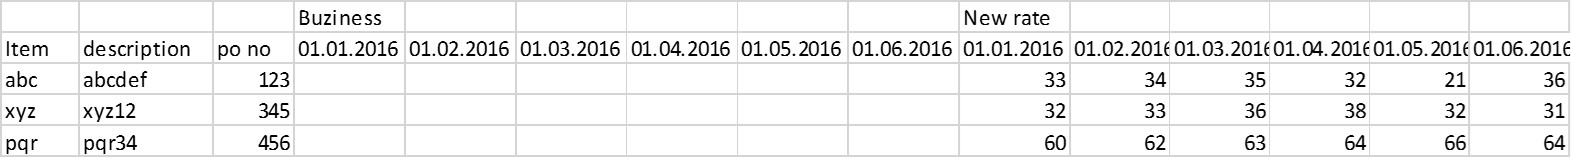
i have two expression Business (fy 16-17) & New rate (month wise).
Business is one value for whole year (irrespective of numbers of entries or new rate), while new rate has more the one entry.
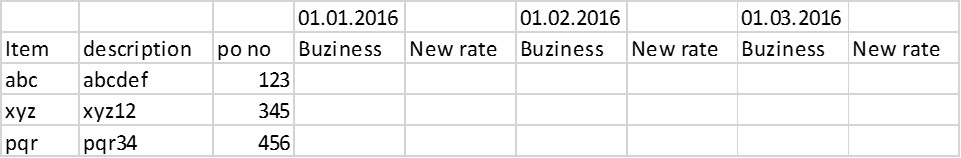
if i tried pivot in qlikview, i will get output as pic 1 & pic 2....
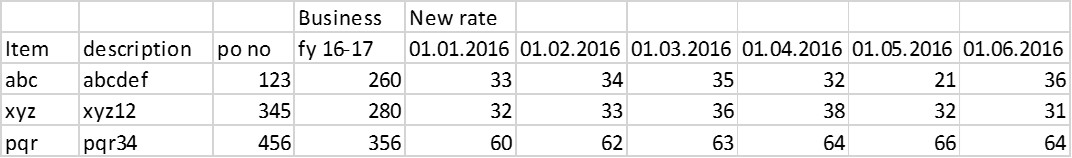
while i would like to have output as pic 3
Pic 1
PIC2
PIC 3
- Mark as New
- Bookmark
- Subscribe
- Mute
- Subscribe to RSS Feed
- Permalink
- Report Inappropriate Content
You can do this by creating a calculated dimension that groups the current set of "New rate" dates with a single artificial value of "Business fy 16-17". A single expression using an IF() that checks on the current dimension value, either the business expression will be used or the New rate expression. I'll see if I can find an example.
Peter
- Mark as New
- Bookmark
- Subscribe
- Mute
- Subscribe to RSS Feed
- Permalink
- Report Inappropriate Content
can u share the sample app?
- Mark as New
- Bookmark
- Subscribe
- Mute
- Subscribe to RSS Feed
- Permalink
- Report Inappropriate Content
Hi,
Can you attach a qvw with some dummy data.
Thanks
Kiran Kumar
- Mark as New
- Bookmark
- Subscribe
- Mute
- Subscribe to RSS Feed
- Permalink
- Report Inappropriate Content
If I am correct you have to make changes in the data model to make one of your fact as dimension so that you can pivot it.
Kiran Kumar
- Mark as New
- Bookmark
- Subscribe
- Mute
- Subscribe to RSS Feed
- Permalink
- Report Inappropriate Content
You will need a dimension that contains the values Business and New rate. And you will need a dimension that contains the values of the months and the value fy 16-17. And you need a table that associates the Business value with fy 16-17 and the months with the value New rate. You can find an idea of what I mean here: Calculation of FY-MOMTD(Month on Month Till date)
Can you post a small qlikview document with example data?
talk is cheap, supply exceeds demand
- Mark as New
- Bookmark
- Subscribe
- Mute
- Subscribe to RSS Feed
- Permalink
- Report Inappropriate Content
It may not look like it, but this discussion will give you a clue about how to create an artificial dimension value and act upon it: Average help