Unlock a world of possibilities! Login now and discover the exclusive benefits awaiting you.
- Qlik Community
- :
- Forums
- :
- Analytics
- :
- New to Qlik Analytics
- :
- Re: Pivot Table columns and totals
- Subscribe to RSS Feed
- Mark Topic as New
- Mark Topic as Read
- Float this Topic for Current User
- Bookmark
- Subscribe
- Mute
- Printer Friendly Page
- Mark as New
- Bookmark
- Subscribe
- Mute
- Subscribe to RSS Feed
- Permalink
- Report Inappropriate Content
Pivot Table columns and totals
Another question I am afraid!
I have some data in a pivot table, but I have a few questions. The table is currently like this:
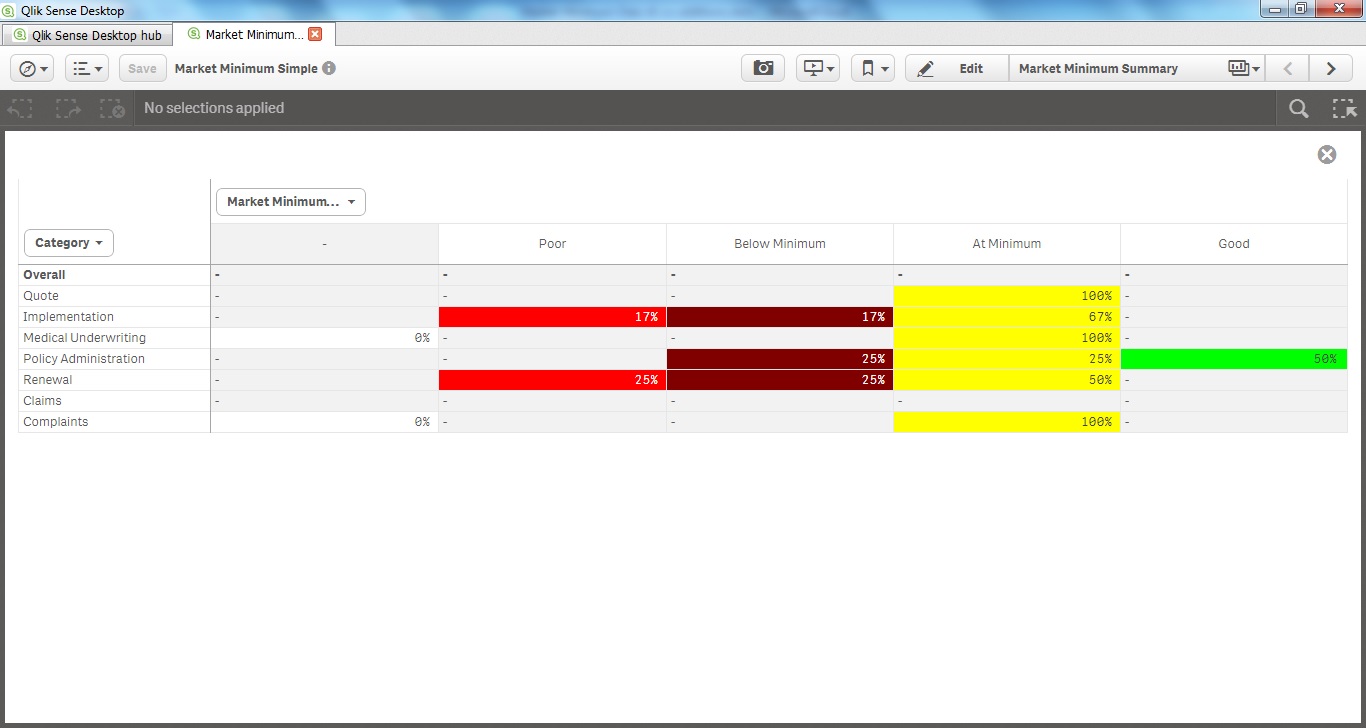
Question 1:
Is it possible to hide the null column? If I hide nulls in the options it will hide the Claims row as well, and I don't want that.
Question 2:
Is it possible to get the null values in for example the Quotes row to show as a 0?
Question 3:
How do I get the column totals to show? Currently the formula in the measure is:
count([Market Minimum Band])/count(total <Category>[Market Minimum Band])
Question 4:
Is it possible to force an extra column in. Between At Minimum and Good there is the possibility of Above Minimum - but in this case there is no data - for consistency I would like to show all the columns at all times - even if they are just 0's.
All help gratefully received. Is a Pivot Table the wrong visualisation?
Many thanks
Chris
- Mark as New
- Bookmark
- Subscribe
- Mute
- Subscribe to RSS Feed
- Permalink
- Report Inappropriate Content
Regarding Question1:
I think there are two places you can control how Sense is displaying NULL / Zero, there is a setting for each dimension and a setting on AddOns - Data handling.
Have you tried the setting for the specific dimension?