Unlock a world of possibilities! Login now and discover the exclusive benefits awaiting you.
- Qlik Community
- :
- Forums
- :
- Analytics
- :
- App Development
- :
- Re: Colour scale using multiple if functions
- Subscribe to RSS Feed
- Mark Topic as New
- Mark Topic as Read
- Float this Topic for Current User
- Bookmark
- Subscribe
- Mute
- Printer Friendly Page
- Mark as New
- Bookmark
- Subscribe
- Mute
- Subscribe to RSS Feed
- Permalink
- Report Inappropriate Content
Colour scale using multiple if functions
Hi all,
I want to at a colour scale from light to dark for the highest value to the lowest value on my pivot table
Is it possible to use a multiple if function or can i use an other function for this
if(hrank(sum([Totaal omzet 2016]))=1,green()),if(hrank(sum([Totaal omzet 2016]))=2,ligt green()) etc…
- Mark as New
- Bookmark
- Subscribe
- Mute
- Subscribe to RSS Feed
- Permalink
- Report Inappropriate Content
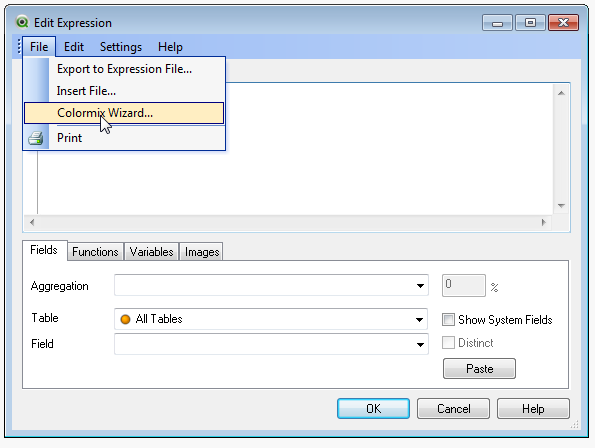
There are two function called ColorMix1 and ColorMix2. You can use the ColorMix Wizard to create an expression that uses one of these. You can find that Wizard in the menu of the expression editor.
talk is cheap, supply exceeds demand
- Mark as New
- Bookmark
- Subscribe
- Mute
- Subscribe to RSS Feed
- Permalink
- Report Inappropriate Content
Hi Gysbert
This is not possible in the click sense app
- Mark as New
- Bookmark
- Subscribe
- Mute
- Subscribe to RSS Feed
- Permalink
- Report Inappropriate Content
Right you are. But if you have qlikview available you could generate the expression in Qlikview and copy it over to the Qlik Sense app. The Colormix functions are available in Qlik Sense too.
But there's another option that is a lot simpler. You can set the Colors setting to Custom and choose By Measure and select one of the four gradient options.
talk is cheap, supply exceeds demand
- Mark as New
- Bookmark
- Subscribe
- Mute
- Subscribe to RSS Feed
- Permalink
- Report Inappropriate Content
Hi Bob
In qlik Sense 2.2 you can use the colormixx function
See my post here with qvf example :
https://community.qlik.com/docs/DOC-16046
the file attached gives examples of how to use variable color to change all the colors of charts and table
ColorMix1( rank(total [your measure expression here])/noofrows(TOTAL) , rgb(15,97,119), rgb(36,242,197))
Regards
Bruno