Unlock a world of possibilities! Login now and discover the exclusive benefits awaiting you.
- Qlik Community
- :
- All Forums
- :
- QlikView App Dev
- :
- Re: Percentage of the total with two dimensions cr...
- Subscribe to RSS Feed
- Mark Topic as New
- Mark Topic as Read
- Float this Topic for Current User
- Bookmark
- Subscribe
- Mute
- Printer Friendly Page
- Mark as New
- Bookmark
- Subscribe
- Mute
- Subscribe to RSS Feed
- Permalink
- Report Inappropriate Content
Percentage of the total with two dimensions crossing
Hi everyone,
what I'm looking for is to display the percentage of the total with two dimensions crossing.
What I would like is to have the % of Pay of the total of Pay per Data crossed per Buyer.
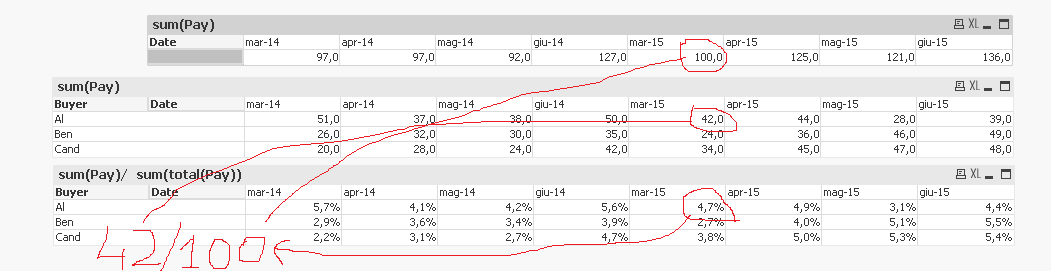
I tried but does not work...
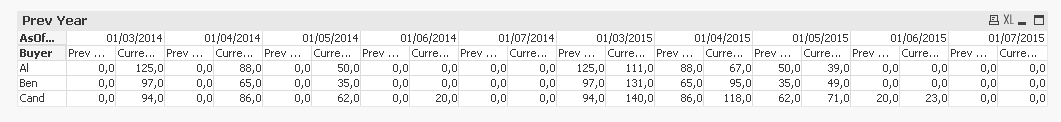
Then what I would like to do is to compare the value of month-year (mar-15) with the month-year before (mar-14) and display it in mar-15 and don't display anymore mar-14. This for every month-year of 15. No display month-year of 14.
The example down there.
Is that clear enough?
Here attached my qvw.
Thank you all.
Filiberto
- « Previous Replies
-
- 1
- 2
- Next Replies »
- Mark as New
- Bookmark
- Subscribe
- Mute
- Subscribe to RSS Feed
- Permalink
- Report Inappropriate Content
So you want a fixed period range?
RangeSum(After(Sum({<FlagYear = {'PY'}>}Pay), 1, 3)) // was: , MonthNum))
- Mark as New
- Bookmark
- Subscribe
- Mute
- Subscribe to RSS Feed
- Permalink
- Report Inappropriate Content
- Mark as New
- Bookmark
- Subscribe
- Mute
- Subscribe to RSS Feed
- Permalink
- Report Inappropriate Content
That's because you show only some months, but across several years.
How do you want to handle year bounderies with regard to 'show next three months'?
I assume, it would be sufficient to create data for all months, without having gaps inbetween.
- Mark as New
- Bookmark
- Subscribe
- Mute
- Subscribe to RSS Feed
- Permalink
- Report Inappropriate Content
Stefan is right, you need to provide some more data for other years and lay out what exactly you would want to see. The more information you provide, the easier it will be to provide a working solution 
- Mark as New
- Bookmark
- Subscribe
- Mute
- Subscribe to RSS Feed
- Permalink
- Report Inappropriate Content
Attached a modified version with an AsOf table based on month, not only CY / PY.
Using this, you'll the correct pay values accumulated even when your table is showing only part of the year or when making selections in your dimension (it doesn't use chart inter records anymore).
In short, an AsOf-table approach.
- Mark as New
- Bookmark
- Subscribe
- Mute
- Subscribe to RSS Feed
- Permalink
- Report Inappropriate Content
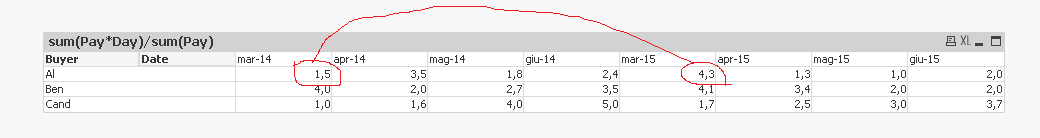
Does this look right?
Script: (Change in Red)
TABLE_TEMP:
LOAD * INLINE [
Date, Buyer, Pay, Day, CAT
01/03/2014, Cand, 10, 1, Open
01/04/2014, Ben, 21, 2, Closed
01/05/2014, Cand, 12, 4, Open
01/06/2014, Ben, 22, 5, Closed
01/03/2015, Ben, 10, 7, Open
01/04/2015, Ben, 21, 3, Closed
01/05/2015, Al, 12, 1, Open
01/06/2015, Al, 22, 2, Closed
01/03/2014, Ben, 8, 4, Open
01/04/2014, Cand, 9, 3, Closed
01/05/2014, Ben, 10, 4, Open
01/06/2014, Cand, 21, 6, Closed
01/03/2015, Cand, 12, 3, Open
01/04/2015, Cand, 22, 3, Closed
01/05/2015, Cand, 23, 2, Open
01/07/2014, Cand, 20, 2, Open
01/07/2015, Cand, 23, 2, Open
01/06/2015, Ben, 24, 3, Open
01/03/2014, Al, 25, 1, Open
01/04/2014, Al, 10, 2, Open
01/05/2014, Al, 10, 4, Open
01/06/2014, Al, 21, 3, Open
01/03/2015, Al, 12, 5, Open
01/04/2015, Al, 13, 2, Open
01/05/2015, Ben, 14, 2, Open
01/06/2015, Cand, 15, 3, Open
01/03/2014, Cand, 10, 1, Open
01/04/2014, Ben, 11, 2, Open
01/05/2014, Cand, 12, 4, Open
01/06/2014, Ben, 13, 1, Open
01/03/2015, Ben, 14, 2, Open
01/04/2015, Ben, 15, 4, Open
01/05/2015, Al, 16, 1, Open
01/06/2015, Al, 17, 2, Open
01/03/2014, Ben, 18, 4, Open
01/04/2014, Cand, 19, 1, Open
01/05/2014, Ben, 20, 2, Closed
01/06/2014, Cand, 21, 4, Closed
01/03/2015, Cand, 22, 1, Closed
01/04/2015, Cand, 23, 2, Closed
01/05/2015, Cand, 24, 4, Closed
01/06/2015, Ben, 25, 1, Closed
01/03/2014, Al, 26, 2, Closed
01/04/2014, Al, 27, 4, Closed
01/05/2014, Al, 28, 1, Closed
01/06/2014, Al, 29, 2, Closed
01/03/2015, Al, 30, 4, Closed
01/04/2015, Al, 31, 1, Closed
01/05/2015, Ben, 32, 2, Closed
01/06/2015, Cand, 33, 4, Closed
];
TABLE:
LOAD Buyer,
Pay,
Day,
CAT,
Date,
RangeMin(AutoNumber(Num(Month(Date))) - 1, 3) as MonthNum
Resident TABLE_TEMP
Order By Date desc;
DROP Table TABLE_TEMP;
AsOf:
LOAD Date as AsOfDate,
Date,
'CY' as FlagYear
Resident TABLE;
- Mark as New
- Bookmark
- Subscribe
- Mute
- Subscribe to RSS Feed
- Permalink
- Report Inappropriate Content
- « Previous Replies
-
- 1
- 2
- Next Replies »