Unlock a world of possibilities! Login now and discover the exclusive benefits awaiting you.
- Qlik Community
- :
- Forums
- :
- Analytics
- :
- App Development
- :
- How to map two date values with Master Calendar?
- Subscribe to RSS Feed
- Mark Topic as New
- Mark Topic as Read
- Float this Topic for Current User
- Bookmark
- Subscribe
- Mute
- Printer Friendly Page
- Mark as New
- Bookmark
- Subscribe
- Mute
- Subscribe to RSS Feed
- Permalink
- Report Inappropriate Content
How to map two date values with Master Calendar?
Hi Folks,
I attached the same data.
I want to two filters like Quarter and Week
Based on these two filters, we need to create bar chart
Dimensions:- Month(when i click Quarter it shows on monthly), Week
Measure:- Count(Ticket)
Sub2u444
- Mark as New
- Bookmark
- Subscribe
- Mute
- Subscribe to RSS Feed
- Permalink
- Report Inappropriate Content
So there are two dates in your sample Ticket 1001 would be plotted on Apr 2014 or Feb 2016?
- Mark as New
- Bookmark
- Subscribe
- Mute
- Subscribe to RSS Feed
- Permalink
- Report Inappropriate Content
Open - Apr2014
Close- Feb2016
like above
- Mark as New
- Bookmark
- Subscribe
- Mute
- Subscribe to RSS Feed
- Permalink
- Report Inappropriate Content
I think you did not understand my question. Let me put it this way. I am guessing that you have MonthYear on your x-axis and would be plotting Count(Tickets) for each MonthYear. Ticket Number 1001 will be plotted on Apr 2014 or Feb 2016?
- Mark as New
- Bookmark
- Subscribe
- Mute
- Subscribe to RSS Feed
- Permalink
- Report Inappropriate Content
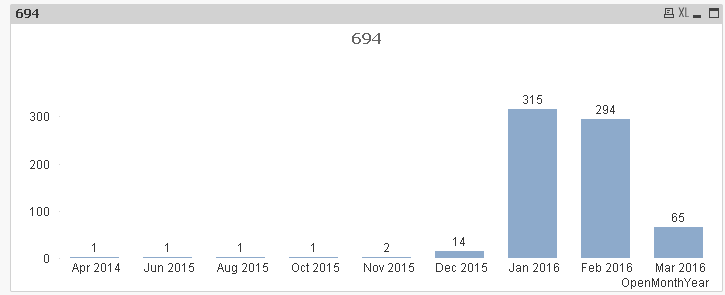
It was under coming to Jan2016...
If its having OpenDate and there is no CloseDate i.e., under coming to Open
- Mark as New
- Bookmark
- Subscribe
- Mute
- Subscribe to RSS Feed
- Permalink
- Report Inappropriate Content
This?
- Mark as New
- Bookmark
- Subscribe
- Mute
- Subscribe to RSS Feed
- Permalink
- Report Inappropriate Content
Above one is correct.
I need to 2 filters i.e., Quarter and Week... i shared the above .. pls check
in the bar chart it was showing some gaps, i don't want that gaps....
Open is looks fine and same for Close i required
this is in QlikSense..Sunny
- Mark as New
- Bookmark
- Subscribe
- Mute
- Subscribe to RSS Feed
- Permalink
- Report Inappropriate Content
Got it, have a meeting, if no one chips in, I will come back and help 