Unlock a world of possibilities! Login now and discover the exclusive benefits awaiting you.
- Qlik Community
- :
- All Forums
- :
- QlikView App Dev
- :
- Re: How to use demonstrate functionality of input ...
- Subscribe to RSS Feed
- Mark Topic as New
- Mark Topic as Read
- Float this Topic for Current User
- Bookmark
- Subscribe
- Mute
- Printer Friendly Page
- Mark as New
- Bookmark
- Subscribe
- Mute
- Subscribe to RSS Feed
- Permalink
- Report Inappropriate Content
How to use demonstrate functionality of input box for a bar chart?
Hi guys,
i wanted to demonstrate a simple functionality of input box to a bar chart, that make sense. Do you guys have any samples?
I am thinking of using bar chart, maybe add in expression like sum sales and sum quantity. The input box , i will use as quantity percentage.
Scenario, if i add in 20% increase in the input box, then the bar chart should show the bar chart changes after there's 20% increase on quantity.
How to do that guys?
Rgds,
Jim
- Mark as New
- Bookmark
- Subscribe
- Mute
- Subscribe to RSS Feed
- Permalink
- Report Inappropriate Content
May be try like this..
Create a variable (vIncr), and use it in your expression
=sum(value)+(sum(value)*$(vIncr))
In the InputBox, enter the value like 0.1 -> 10% 1-> 100%
Sample attached
- Mark as New
- Bookmark
- Subscribe
- Mute
- Subscribe to RSS Feed
- Permalink
- Report Inappropriate Content
Hi,
May be like this,
INPUTFIELD InputVar;
INPUTFIELD Call;

LOAD Location,
     Value,
     0 as InputVar,
     1 as Call
FROM
[Data]
(html, codepage is 1252, embedded labels, table is @1);
At Front End:
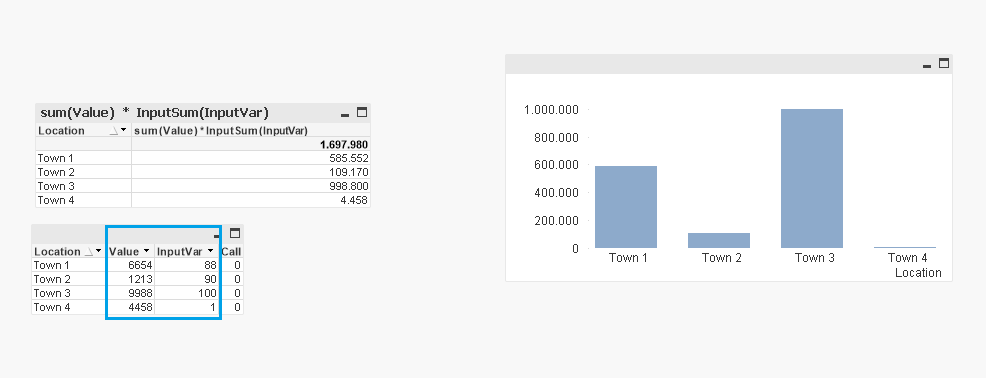
By entering or changing the values , in the input box will make a change in Bar chart.
Hope this helps for your requirement,
PFA,
Hirish
“Aspire to Inspire before we Expire!”
- Mark as New
- Bookmark
- Subscribe
- Mute
- Subscribe to RSS Feed
- Permalink
- Report Inappropriate Content
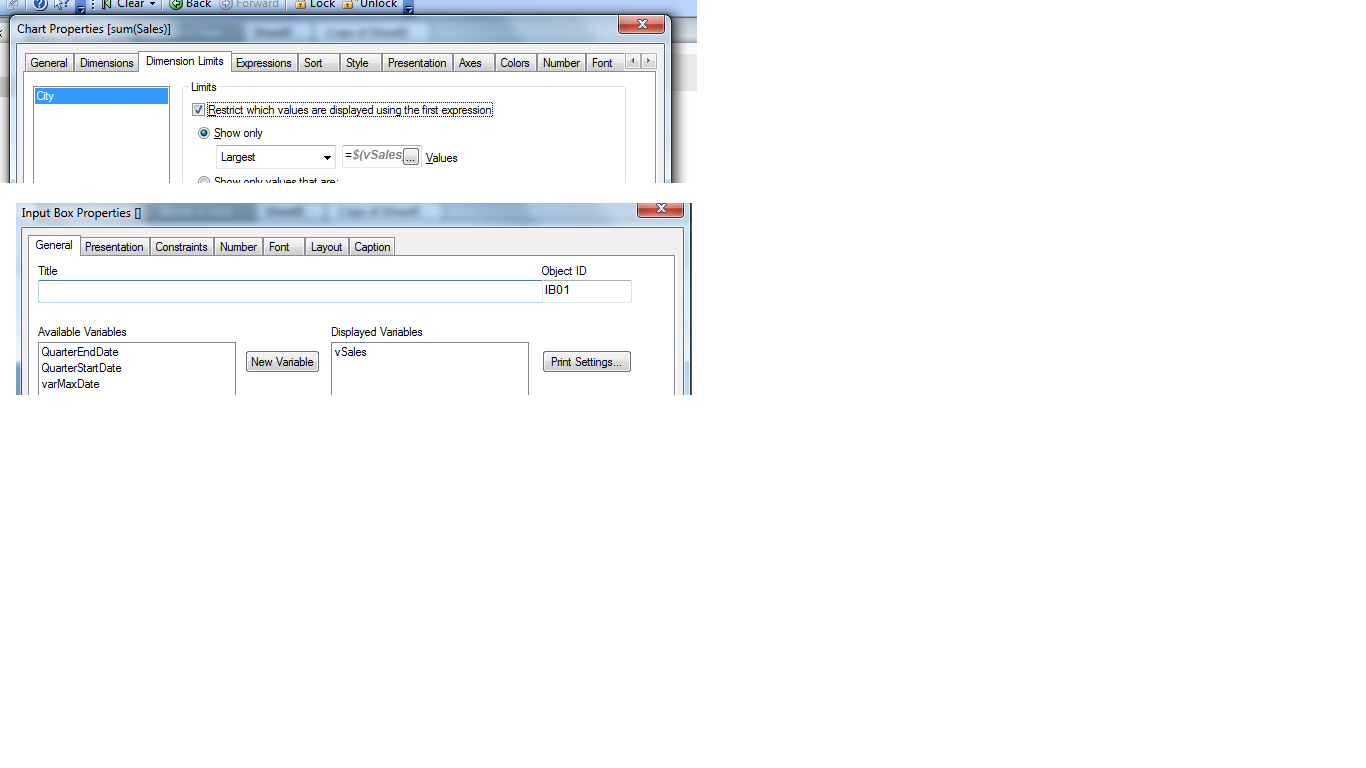
Hi,
You can create a chart of your choice with dimension and expression as per your requirements. Create a Variable for eg:- VIncrease, now use this variable in dimension limits of chart property.. Create a Input Box in your GUI and use the same variable there so now as and wen there will be changes made to ur input box, the chart will change accordingly..
Hope this will help..
Saniya..
- Mark as New
- Bookmark
- Subscribe
- Mute
- Subscribe to RSS Feed
- Permalink
- Report Inappropriate Content
See the attached document.