Unlock a world of possibilities! Login now and discover the exclusive benefits awaiting you.
- Qlik Community
- :
- Forums
- :
- Analytics
- :
- New to Qlik Analytics
- :
- Re: How to only use selected values in a dimension...
- Subscribe to RSS Feed
- Mark Topic as New
- Mark Topic as Read
- Float this Topic for Current User
- Bookmark
- Subscribe
- Mute
- Printer Friendly Page
- Mark as New
- Bookmark
- Subscribe
- Mute
- Subscribe to RSS Feed
- Permalink
- Report Inappropriate Content
How to only use selected values in a dimension on a bar chart
Hello,
I am having trouble editing a dimension to only include certain values. The dimension is called [Module] and it is a list of over 80 modules. I want to create a bar chart that only shows the pass rates of the modules that contain a certain value, such as 'Core 1' or 'Core 2'.
I've tried dimension grouping however that only allows me to see the 'Core 1" modules as 1 bar, but I need a separate bar for each 'Core 1' module and all other modules to not appear on the chart
Any help is appreciated!
Thanks
- Tags:
- ignore dimension
- « Previous Replies
-
- 1
- 2
- Next Replies »
- Mark as New
- Bookmark
- Subscribe
- Mute
- Subscribe to RSS Feed
- Permalink
- Report Inappropriate Content
What do you mean with 'pass rates of the modules that contain a certain value', i.e. where, in which field can we look for these values?
You should be able to do something like this as calculated dimension (and enable 'Suppress When Values Is NULL')
=If( Module like 'Core *', Module)
or maybe
=If(Match(Module, 'Core 1', 'Core 2'), Module)
If you want to filter modules looking into another related field with a 1:1 relation:
=If( WildMatch(OtherField, 'Core *','Other?Matc?ing*'), Module)
If you want to group all other modules into 'Other':
=If( Module like 'Core *', Module, 'Other')
Edit:
You might also be able to filter your dimension using e.g. set analysis, but before talking about this, please elaborate further on your setting (see above)
- Mark as New
- Bookmark
- Subscribe
- Mute
- Subscribe to RSS Feed
- Permalink
- Report Inappropriate Content
Just to add to the list, this might work as well:
Aggr(Only({1<Module = { 'Core 1', 'Core 2'}>} Module), Module)
- Mark as New
- Bookmark
- Subscribe
- Mute
- Subscribe to RSS Feed
- Permalink
- Report Inappropriate Content
Hi Ryan,
As Sunny mentioned, a set analysis expression should help solve your issue. If possible try flagging the dimensions in the load script to improve performance.
Thanks,
Sangram.
- Mark as New
- Bookmark
- Subscribe
- Mute
- Subscribe to RSS Feed
- Permalink
- Report Inappropriate Content
Thanks for your help. To try and bet more clear:
The Dimension [Module] is an excel column which contains a list of 80 or so different modules that were ran. 8 of them are Core 1 modules, so their name is 'Core 1 - Year' I need to do analysis of the specific module Core 1, not the entire list. Therefore I want to create a bar graph that shows me only the 8 Core 1 modules.
Hope this helps!
- Mark as New
- Bookmark
- Subscribe
- Mute
- Subscribe to RSS Feed
- Permalink
- Report Inappropriate Content
Ok, so have you tried either
=If( Module like 'Core 1*', Module)
and enabling the 'Suppress when Value is NULL' option on dimension tab
or
using set analysis in all your expression aggregation function(s), e.g.
=Sum({<Module = {"Core 1*"}>} Value)
?
- Mark as New
- Bookmark
- Subscribe
- Mute
- Subscribe to RSS Feed
- Permalink
- Report Inappropriate Content
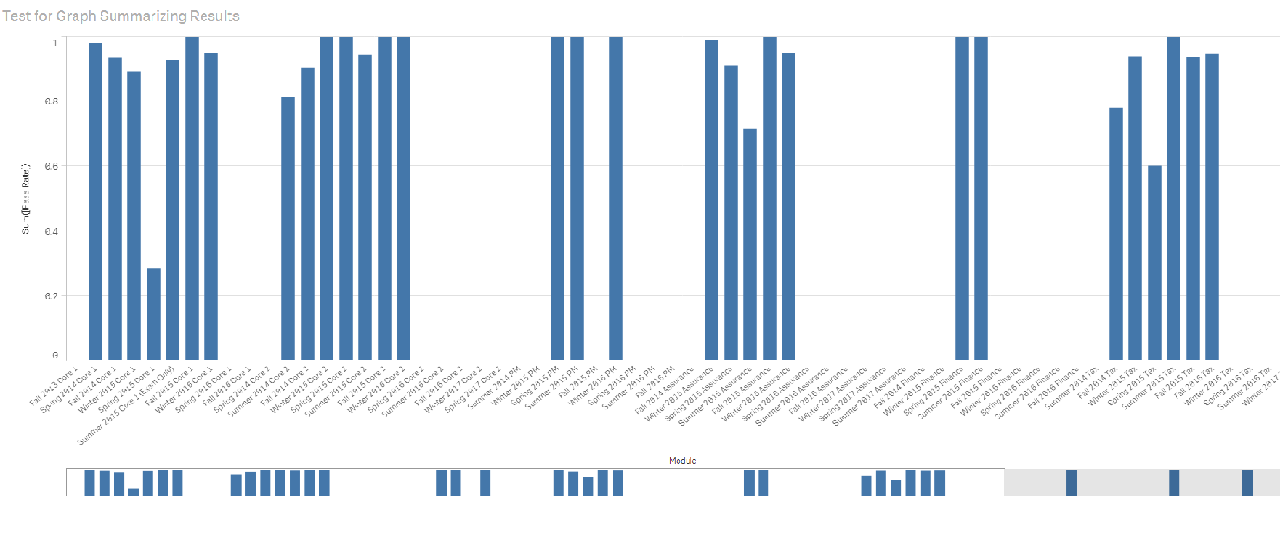
I've tried the syntax shown above, however it doesn't seem to be working. It takes my initial unadjusted dimension of all modules and combines the Core 1 module's into one bar. I need them to be in separate bars. I've attached a couple screenshots of the before.
- Mark as New
- Bookmark
- Subscribe
- Mute
- Subscribe to RSS Feed
- Permalink
- Report Inappropriate Content
Can you try Module as your dimension and
Expression -> =Sum({<Module = {"*Core 1*"}>} Value) or =Sum({<Module = {'*Core 1*'}>} Value)
- Mark as New
- Bookmark
- Subscribe
- Mute
- Subscribe to RSS Feed
- Permalink
- Report Inappropriate Content
if([Module] = 'Core 1 - Year', [Module], )
I think that's all you'll need in the chart
- Mark as New
- Bookmark
- Subscribe
- Mute
- Subscribe to RSS Feed
- Permalink
- Report Inappropriate Content
I can't really read the dimension values of the charts in your screenshots on my screen, but I assume that you need to adapt the search as Sunny suggested.
In my above suggested calculated dimensions (and also in the set analysis), I've used LIKE operator and Wildmatch() function to be able to use wild cards in the value comparison. But the search value needs to be created correctly to result in your requested dimension value matches.
The star symbol * is a wildcard for any number of unspecified characters, while the question mark ? is a wildcard for a single unknown character.
You probably just need to adapt the comparison value using appropriate wildcards, like
=If( Module like '*Core 1*', Module, 'Other')
like Sunny also suggested.
'*Core 1*' is telling QV to look for modules that contain 'Core 1' anywhere in the module name, doesn't matter if there are any other characters before or after 'Core 1'.
Regards,
Stefan
- « Previous Replies
-
- 1
- 2
- Next Replies »