Unlock a world of possibilities! Login now and discover the exclusive benefits awaiting you.
- Qlik Community
- :
- Forums
- :
- Analytics
- :
- New to Qlik Analytics
- :
- Re: Last 4 Quarters
- Subscribe to RSS Feed
- Mark Topic as New
- Mark Topic as Read
- Float this Topic for Current User
- Bookmark
- Subscribe
- Mute
- Printer Friendly Page
- Mark as New
- Bookmark
- Subscribe
- Mute
- Subscribe to RSS Feed
- Permalink
- Report Inappropriate Content
Last 4 Quarters
Hi all,
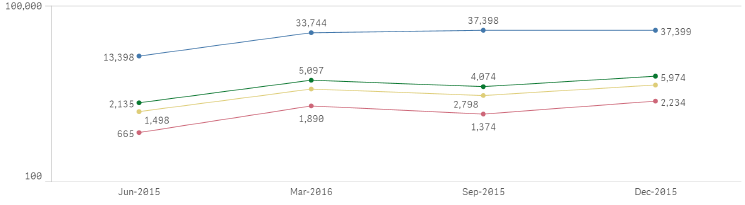
I am displaying a values in a line graph for last 4 Quarters, Using the Below Dimension and Measures
Dimension : if(Last4Quarters = 1, Month(QuarterEnd(CanonicalDate)) & '-' & year(QuarterEnd(CanonicalDate)))
Measure : Count({$<DateType = {invitation}, client_id ={'12','13','15','18','19'}>}invitation_id)
Load Script:
let varRyear = Num(AddYears(today(),-1));
let varLast4Quarters = num(QuarterEnd(Addmonths(today(),-3)));
let varStartDate = num(AddYears($(varLast4Quarters),-1));
CalendarMaster:
Load *,
if (([CanonicalDate] > $(varStartDate)),if(([CanonicalDate] < $(varLast4Quarters)),1)) as [Last4Quarters];
As we are in 4th month it should display mar-2016 in graph but it is not.
Please help where i am doing wrong.
Regards,
Pramod
- Tags:
- quarter comparison
- Mark as New
- Bookmark
- Subscribe
- Mute
- Subscribe to RSS Feed
- Permalink
- Report Inappropriate Content
Do you have a sample you can share? The variable settings seems right, not sure what might be missing here
- Mark as New
- Bookmark
- Subscribe
- Mute
- Subscribe to RSS Feed
- Permalink
- Report Inappropriate Content
Sorry working on server, don't have any sample data..... any other suggestions to debug
- Mark as New
- Bookmark
- Subscribe
- Mute
- Subscribe to RSS Feed
- Permalink
- Report Inappropriate Content
I guess first thing to check would be to create a table with CanonicalDate and Last4Quarter as dimensions to see if they line up. Based on your code, you should see 1 for Last4Quarter between the dates 04/01/2015 - 03/30/2016
Is this showing up correctly?
- Mark as New
- Bookmark
- Subscribe
- Mute
- Subscribe to RSS Feed
- Permalink
- Report Inappropriate Content
Thanks for the Reply sunny,
It's displaying the Mar-2016 in graph but it's not in order, sorry i dint checked it properly.
- Mark as New
- Bookmark
- Subscribe
- Mute
- Subscribe to RSS Feed
- Permalink
- Report Inappropriate Content
I did not see that also, my bad 
- Mark as New
- Bookmark
- Subscribe
- Mute
- Subscribe to RSS Feed
- Permalink
- Report Inappropriate Content
Hi Pramod,
So is the issue with the sorting now? If so did you try the custom sort option in the properties panel?