Unlock a world of possibilities! Login now and discover the exclusive benefits awaiting you.
- Qlik Community
- :
- Forums
- :
- Analytics
- :
- New to Qlik Analytics
- :
- Re: Qlik Sense Map object not working
- Subscribe to RSS Feed
- Mark Topic as New
- Mark Topic as Read
- Float this Topic for Current User
- Bookmark
- Subscribe
- Mute
- Printer Friendly Page
- Mark as New
- Bookmark
- Subscribe
- Mute
- Subscribe to RSS Feed
- Permalink
- Report Inappropriate Content
Qlik Sense Map object not working
Hello there,
I am trying to figure it out how simple can we create a functional Map object in Qlik Sense. There are BI tool, when you have loaded up data, you drag in a map object, you add in a Country dimension, you will get a functional map object.
But, i have tried with Qlik Sense Map, i coudlnt achieve the same result with same steps i did it in another BI tool.
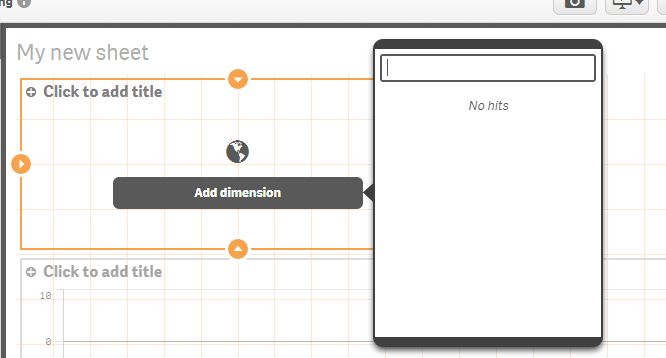
As you can see from my qlik sense map object, i have loaded a country table. But when i click on "add dimension" it shows nothing. When i dragged and dropped a country dimension to this map object, it says "the the action you are attempting cannot be applied...."
So, i would like to know , what can i do to get the map object work?
Thanks.
Rgds,
Jim
- Mark as New
- Bookmark
- Subscribe
- Mute
- Subscribe to RSS Feed
- Permalink
- Report Inappropriate Content
I am having same issue. Any response or pointers. I have valid City Names, Latitude and Longitude values loaded in single table but do not get a hit as well on Map object. Only data loaded through a KML file seems to work.
- Mark as New
- Bookmark
- Subscribe
- Mute
- Subscribe to RSS Feed
- Permalink
- Report Inappropriate Content
Hi Jim,
Can you share your qvf file?
Regards,
Rohan
- Mark as New
- Bookmark
- Subscribe
- Mute
- Subscribe to RSS Feed
- Permalink
- Report Inappropriate Content
Hi Jim.
In standard Sense coordinates or a KML file is required to render anything.
However, IdevioMaps for Qlik Sense provides on-the-fly geocoding, which does what you want. No need for coordinates, just a table with names of countries, counties, places, zip codes etc and IdevioMaps will render symbols or areas accordingly.
More info and live demos at QlikMarket:
http://market.qlik.com/ideviomaps-for-qlik-sense.html
Thanks,
Patric Nordström, Idevio
- Mark as New
- Bookmark
- Subscribe
- Mute
- Subscribe to RSS Feed
- Permalink
- Report Inappropriate Content
Hi Jim,
Do you have Latitude and Longitude information in your data model. Or do you gave any polygon information imported from a KML or a CSV file. You will need this information for sure to use the map object.
Once you have the Lat and Long info, make use of the GeoMakePoint(Lat,Long) in your data load editor to plot points using a MAP Object.
Thanks,
Sangram.
- Mark as New
- Bookmark
- Subscribe
- Mute
- Subscribe to RSS Feed
- Permalink
- Report Inappropriate Content
- Mark as New
- Bookmark
- Subscribe
- Mute
- Subscribe to RSS Feed
- Permalink
- Report Inappropriate Content
Normally, when you load data that goes with a map, Qlik automagically detects the relevant columns and tags them so that the Map chart knows which ones it can work with and how they apply. Most people use the web GUI to load data files, and that will sample your column names and data so that it can try to guess what columns should have the special tags applied.
For whatever the reason, that isn't working for you. So you need to go into the "Data load editor" and customize the Load Script in your App to manual/explicity add the appropriate tag(s) yourself. In this case, you're wanting either the $geopoint or $geomultipolygon tags, depending on if your data is a location/point or if it describes a shape/polygon/area, respectively.
For example, let's say we loaded the that sample KML that most people refer to. And let's suppose we renamed the file ("world.kml" to "geomap-iso-country.kml") as well as used our own column names---instead of the odd ones that everyone else tends to use because they're in the examples.
GeoMapIsoCountry:
LOAD
[geomap-iso-country.Name] AS IsoCountryCode
, [geomap-iso-country.Area] AS IsoCountryPolygons
FROM [lib://MyFolderDataConnection/geomap-iso-country.kml] (kml);
Qlik's Map chart won't know it can use this data, so after that LOAD, we need to manually tag it ourselves...
TAG FIELD IsoCountryPolygons WITH $geomultipolygon;
And now that the field is appropriately tagged, the Map chart will work; you can now pick Dimensions. Please be aware that tags do not survive a column rename (via the RENAME FIELDS command), so apply your tags after any such operations.