Unlock a world of possibilities! Login now and discover the exclusive benefits awaiting you.
- Qlik Community
- :
- All Forums
- :
- QlikView App Dev
- :
- Re: show thing is not working
- Subscribe to RSS Feed
- Mark Topic as New
- Mark Topic as Read
- Float this Topic for Current User
- Bookmark
- Subscribe
- Mute
- Printer Friendly Page
- Mark as New
- Bookmark
- Subscribe
- Mute
- Subscribe to RSS Feed
- Permalink
- Report Inappropriate Content
show thing is not working
Hi,
I am trying to show a table only if when either of these fields get selected
1.SUPCAT,
2.A add dimension field(=Aggr(FirstSortedValue({<ROLE={'EVAL'},SUPCAT=,QUATERS=,YEAR=,name1=>}SUPCAT, -DATE_OF_REVIEW), name1)) which is name1
so in table under layout conditions i wrote this
GetSelectedCount(SUPCAT)=1 or GetSelectedCount(name1)=1
so when i select supcat filed i am able to show the table
but when i select a pie chart which is having a add dimension as name1 filed then i am not able to show the table ,
even tried like this
GetSelectedCount(SUPCAT)=1 or GetSelectedCount(Aggr(FirstSortedValue({<ROLE={'EVAL'},SUPCAT=,QUATERS=,YEAR=,name1=>}SUPCAT, -DATE_OF_REVIEW), name1))=1
- Mark as New
- Bookmark
- Subscribe
- Mute
- Subscribe to RSS Feed
- Permalink
- Report Inappropriate Content
was it working for you, i copy paste your expression but it was not working in my app
- Mark as New
- Bookmark
- Subscribe
- Mute
- Subscribe to RSS Feed
- Permalink
- Report Inappropriate Content
I don't really know what you are trying to do. Can you open my qvw and check if this is doing what you want it to do?
- Mark as New
- Bookmark
- Subscribe
- Mute
- Subscribe to RSS Feed
- Permalink
- Report Inappropriate Content
Hi naveer, it seems like your table is stucked behind the bar chart (No. of Audits Per Quarter). Hide that bar chart when the table is shown, and you'll solve the problem.
Check the attached file.
- Mark as New
- Bookmark
- Subscribe
- Mute
- Subscribe to RSS Feed
- Permalink
- Report Inappropriate Content
currently i got personal addition, but what i am looking , if i say in simple i need to display the table when i select any values from pie chart
- Mark as New
- Bookmark
- Subscribe
- Mute
- Subscribe to RSS Feed
- Permalink
- Report Inappropriate Content
any value means any single value? or can it be multiple values?
- Mark as New
- Bookmark
- Subscribe
- Mute
- Subscribe to RSS Feed
- Permalink
- Report Inappropriate Content
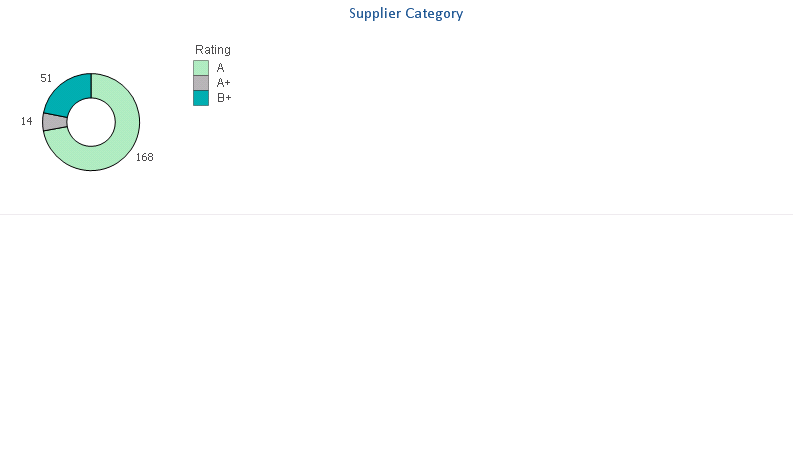
if u see my pie chart it has values like 51,14,168,so i mean on selecting any one value i should see this table
- Mark as New
- Bookmark
- Subscribe
- Mute
- Subscribe to RSS Feed
- Permalink
- Report Inappropriate Content
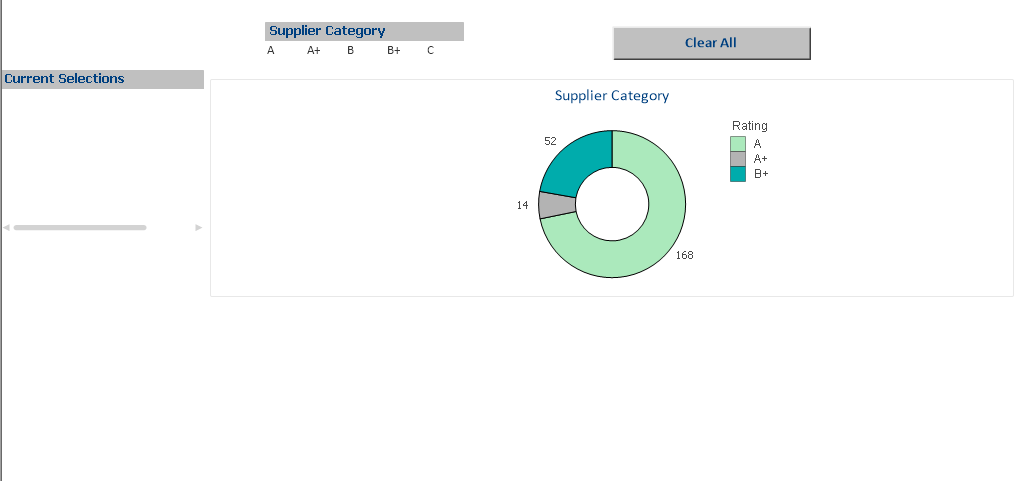
Seems to be working for me:
1) No selection
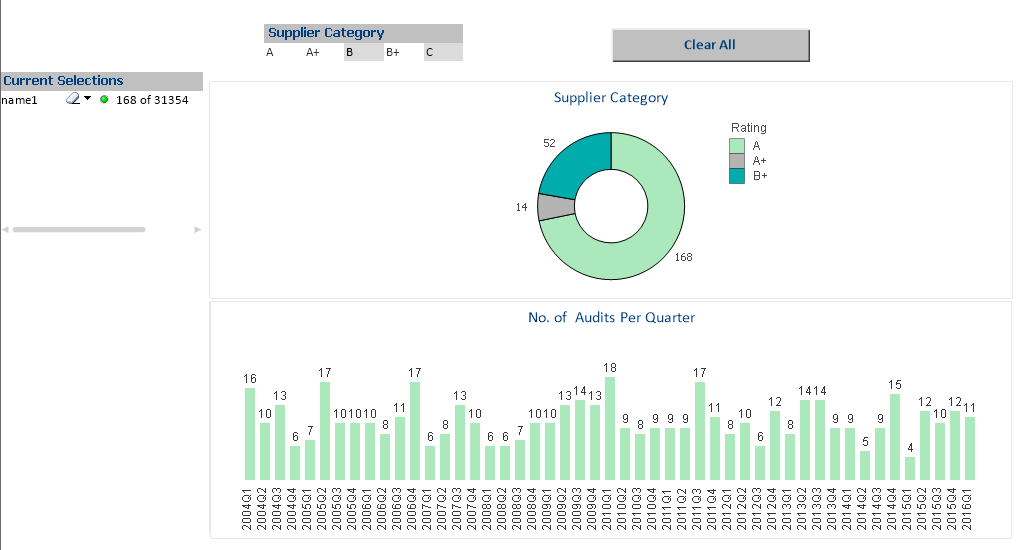
2) One selection
3) Multiple selections
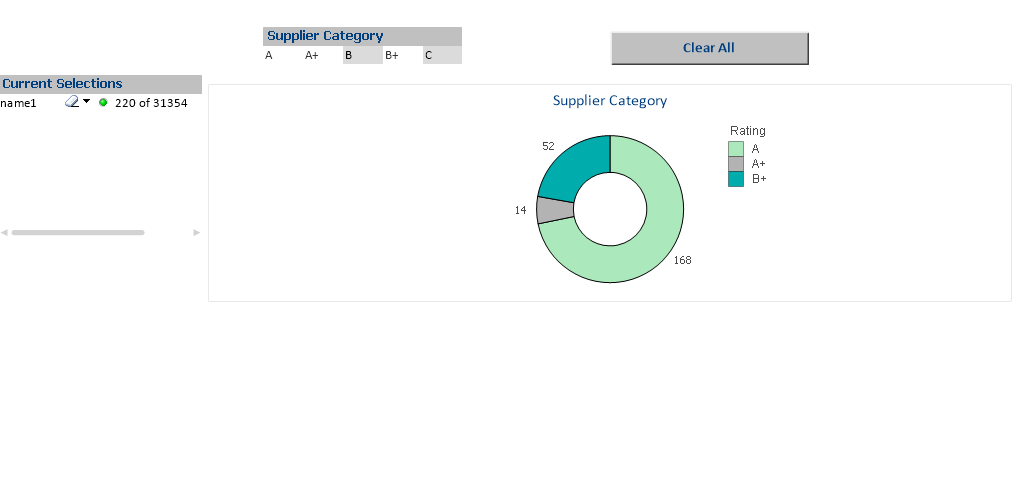
So the table shows up only when you select one part of your pie chart.
Once again the Expression used:
GetSelectedCount(SUPCAT)=1 or Count(Distinct Aggr(FirstSortedValue({<ROLE={'EVAL'},SUPCAT=,QUATERS=,YEAR=,name1=>}SUPCAT, -DATE_OF_REVIEW), name1)) = 1
- Mark as New
- Bookmark
- Subscribe
- Mute
- Subscribe to RSS Feed
- Permalink
- Report Inappropriate Content
Hello sunny,
actually i want to hide this bar chart and show table (which is behind this bar chart) on selecting any value in pie chart,i mean if we select 52 from pie chart then see should able to see all those 52 supplier in the below table
- Mark as New
- Bookmark
- Subscribe
- Mute
- Subscribe to RSS Feed
- Permalink
- Report Inappropriate Content
Any more helps and suggestion plz
- Mark as New
- Bookmark
- Subscribe
- Mute
- Subscribe to RSS Feed
- Permalink
- Report Inappropriate Content
Did you see my answer?