Unlock a world of possibilities! Login now and discover the exclusive benefits awaiting you.
- Qlik Community
- :
- All Forums
- :
- QlikView App Dev
- :
- Re: Chart Visual Cues / Calculation
- Subscribe to RSS Feed
- Mark Topic as New
- Mark Topic as Read
- Float this Topic for Current User
- Bookmark
- Subscribe
- Mute
- Printer Friendly Page
- Mark as New
- Bookmark
- Subscribe
- Mute
- Subscribe to RSS Feed
- Permalink
- Report Inappropriate Content
Chart Visual Cues / Calculation
Hi !
When i expand the table, i want the cells that are markd red to not show any calculated value. Is this possible?
- « Previous Replies
-
- 1
- 2
- Next Replies »
- Mark as New
- Bookmark
- Subscribe
- Mute
- Subscribe to RSS Feed
- Permalink
- Report Inappropriate Content
Hi, Marius August Larsen.
Do you have some metric that must be shown gray or other color? Example:
>=60000 = color white;
>= 100 and <60000 gray;
Regards,
Jonas Melo.
- Mark as New
- Bookmark
- Subscribe
- Mute
- Subscribe to RSS Feed
- Permalink
- Report Inappropriate Content
Attach your sample please
If the issue is solved please mark the answer with Accept as Solution & like it.
If you want to go quickly, go alone. If you want to go far, go together.
- Mark as New
- Bookmark
- Subscribe
- Mute
- Subscribe to RSS Feed
- Permalink
- Report Inappropriate Content
When the pivot table is collapsed, everything is okey.

when i expand the table, it gets messi.
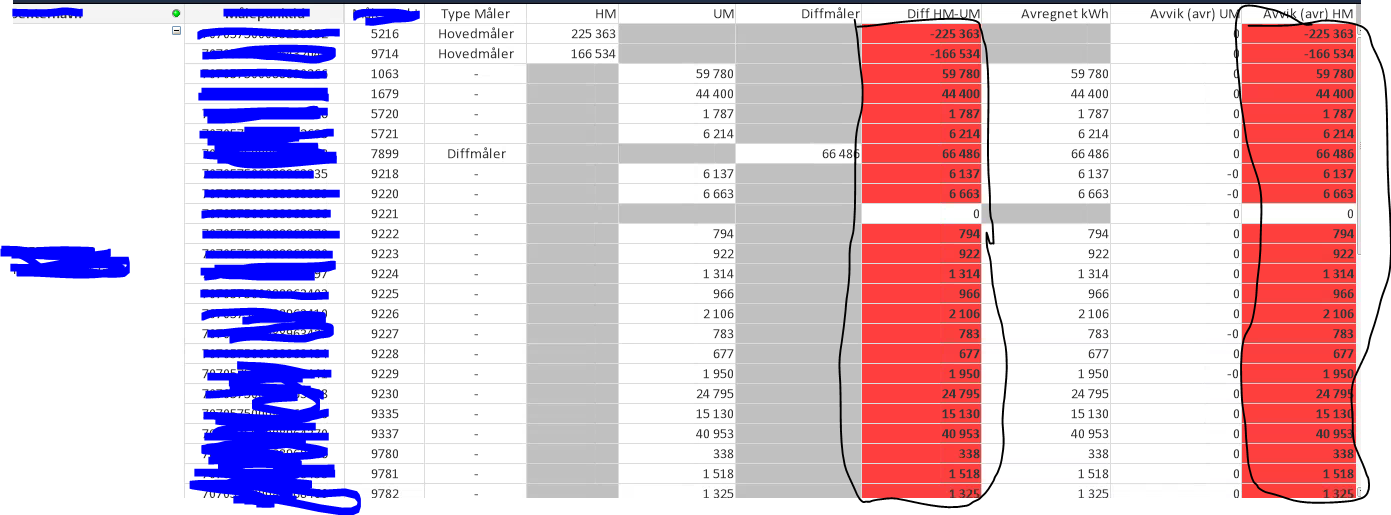
The values in DIFF-HM-UM and avvik avr hm are calculated values from HM, UM and diff.
i want the red calculated values to show grey when i expand the pivot table.
If there are none values in HM AND UM to calculate with, show grey. How can i implimantate this in my qv application ?
- Mark as New
- Bookmark
- Subscribe
- Mute
- Subscribe to RSS Feed
- Permalink
- Report Inappropriate Content
Hi, Marius August Larsen.
Try:
In background color of expression DIFF-HM-UM. Ex.:
if(above(HM,0)>0, RGB(192,192,192), Red()) //If you need, use Dimensionality().
Case solve your problem, adapt for your necessity.
Hope this helps!
- « Previous Replies
-
- 1
- 2
- Next Replies »