Unlock a world of possibilities! Login now and discover the exclusive benefits awaiting you.
- Qlik Community
- :
- All Forums
- :
- QlikView Administration
- :
- Re: Custom Date Range to display in Bar Chart
- Subscribe to RSS Feed
- Mark Topic as New
- Mark Topic as Read
- Float this Topic for Current User
- Bookmark
- Subscribe
- Mute
- Printer Friendly Page
- Mark as New
- Bookmark
- Subscribe
- Mute
- Subscribe to RSS Feed
- Permalink
- Report Inappropriate Content
Custom Date Range to display in Bar Chart
Hello All,
Fairly new to this awesome tool and community.
My data spans 20 years and for a particular chart I would like to only display data for 2016-2019.
My expression is a simple count.
What is the best approach to do this?
As a side, I did manage to create a list box and limiting it to 2016-2019, however, dont know the optimal method to limit the data range in the chart.
Any help much appreciated.
Best.
Sarosh
- Mark as New
- Bookmark
- Subscribe
- Mute
- Subscribe to RSS Feed
- Permalink
- Report Inappropriate Content
As a side, I did manage to create a list box and limiting it to 2016-2019, however, dont know the optimal method to limit the data range in the chart.
That's a very good way to do it. It leaves the user free to change the range if necessary.
You can also limit the range in the expressions. Suppose you have a Year field and an expression sum(Forecast). To limit that expression to 2016-2019 you'd change it to sum({<Year={2016,2017,2018,2019}>}Forecast) or to sum({<Year={'>=2016<=2019'}>}Forecast).
Yet another way is to create a bookmark for that selection and then use the bookmark (for example a bookmark with ID BM04) in the expression: sum({BM04}Forecast).
And if you really only need that range and won't use data from the other years in your document at all, then don't load the data from those years. Load only the data you need in the script and filter out the other data with a WHERE clause in the load statement:
MyTable:
LOAD * FROM MySource WHERE Year >= 2016 and Year <=2019;
talk is cheap, supply exceeds demand
- Mark as New
- Bookmark
- Subscribe
- Mute
- Subscribe to RSS Feed
- Permalink
- Report Inappropriate Content
Thank you so much for the detailed response.
- Mark as New
- Bookmark
- Subscribe
- Mute
- Subscribe to RSS Feed
- Permalink
- Report Inappropriate Content
Hi ,
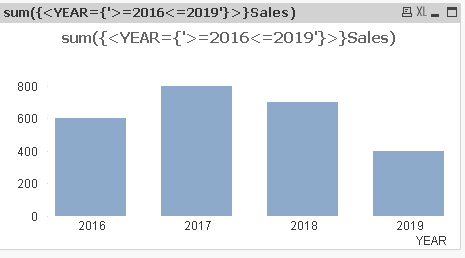
Please see the below chart expression. using YEAR dimension.
- Mark as New
- Bookmark
- Subscribe
- Mute
- Subscribe to RSS Feed
- Permalink
- Report Inappropriate Content
Thank you Sreeni! The visual was great.