Unlock a world of possibilities! Login now and discover the exclusive benefits awaiting you.
- Qlik Community
- :
- All Forums
- :
- QlikView App Dev
- :
- Year, month, week format?
- Subscribe to RSS Feed
- Mark Topic as New
- Mark Topic as Read
- Float this Topic for Current User
- Bookmark
- Subscribe
- Mute
- Printer Friendly Page
- Mark as New
- Bookmark
- Subscribe
- Mute
- Subscribe to RSS Feed
- Permalink
- Report Inappropriate Content
Year, month, week format?
Hi,
is it possible to produce the following format in QlikView?
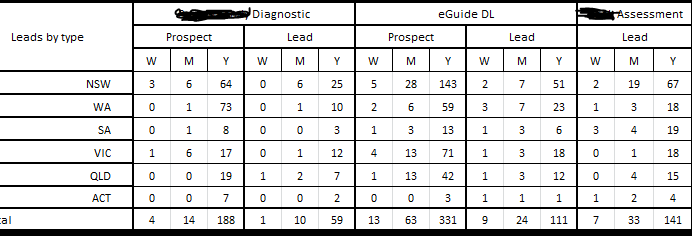
I have tried several things without luck. Any help appreciated
- « Previous Replies
- Next Replies »
Accepted Solutions
- Mark as New
- Bookmark
- Subscribe
- Mute
- Subscribe to RSS Feed
- Permalink
- Report Inappropriate Content
I guess you need to ignore selections in other date fields:
=Count({<%DateEmpFormAdded = {"$(='>=' & Date(AddYears(Max(%DateEmpFormAdded), - 1)) & '<=' & Date(AddYears(Max(%DateEmpFormAdded), 0)))"}, DateEmpMonth, DateEmpYear, DateEmpMonthYear>}EngagementType)
- Mark as New
- Bookmark
- Subscribe
- Mute
- Subscribe to RSS Feed
- Permalink
- Report Inappropriate Content
How exactly are you getting those numbers? May be if you can share your sample data with the logic behind the numbers, we might be able to offer some help 
- Mark as New
- Bookmark
- Subscribe
- Mute
- Subscribe to RSS Feed
- Permalink
- Report Inappropriate Content
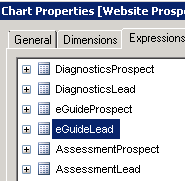
For each I have an expression Engagement Type I have separated into prospect and lead.
=if(#1='Book' and EngagementType='Lead',count(EngagementType))
- Mark as New
- Bookmark
- Subscribe
- Mute
- Subscribe to RSS Feed
- Permalink
- Report Inappropriate Content
I am looking for the raw data (dummy should work) in an Excel tile to create something similar for what you currently have
- Mark as New
- Bookmark
- Subscribe
- Mute
- Subscribe to RSS Feed
- Permalink
- Report Inappropriate Content
sample data
- Mark as New
- Bookmark
- Subscribe
- Mute
- Subscribe to RSS Feed
- Permalink
- Report Inappropriate Content
One more questions:
What is W, M, Y ? (Week, Month, Year?) How are you calculating these numbers? Most recent week, month, year?
- Mark as New
- Bookmark
- Subscribe
- Mute
- Subscribe to RSS Feed
- Permalink
- Report Inappropriate Content
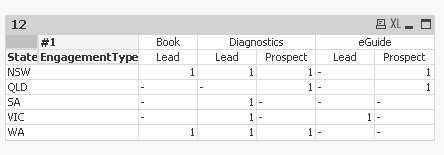
Not sure, but is this what you want? Created this using Pivot Table
- Mark as New
- Bookmark
- Subscribe
- Mute
- Subscribe to RSS Feed
- Permalink
- Report Inappropriate Content
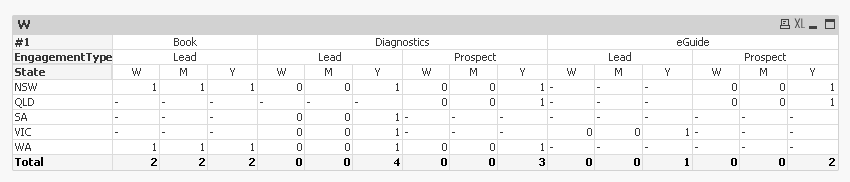
yes W M Y stands for week month year.
That looks good but are you able to add the week month as well?
Laura Castagna
Business Systems and Process Analyst, NSW Business Chamber
140 Arthur Street North Sydney NSW 2060
Tel: 02 9458 7804 | Mob: 0429 486 934 | Web: www.nswbusinesschamber.com.au<http://www.nswbusinesschamber.com.au>
Twitter<http://www.twitter.com/nswbc> | Facebook<https://www.facebook.com/NSWBusinessChamber> | LinkedIn<http://www.linkedin.com/company/388425?trk=saber_s000001e_1000> | YouTube<http://www.youtube.com/nswbctv>
<http://www.nswbusinesschamber.com.au/>
- Mark as New
- Bookmark
- Subscribe
- Mute
- Subscribe to RSS Feed
- Permalink
- Report Inappropriate Content
How do you calculate Week, Month, Year? Most recent?
- Mark as New
- Bookmark
- Subscribe
- Mute
- Subscribe to RSS Feed
- Permalink
- Report Inappropriate Content
May be this:
- « Previous Replies
- Next Replies »