Unlock a world of possibilities! Login now and discover the exclusive benefits awaiting you.
- Qlik Community
- :
- Forums
- :
- Analytics
- :
- New to Qlik Analytics
- :
- Re: can you help me in set analysis
- Subscribe to RSS Feed
- Mark Topic as New
- Mark Topic as Read
- Float this Topic for Current User
- Bookmark
- Subscribe
- Mute
- Printer Friendly Page
- Mark as New
- Bookmark
- Subscribe
- Mute
- Subscribe to RSS Feed
- Permalink
- Report Inappropriate Content
can you help me in set analysis
Hi ,
I have problem in calculation logic.
formula level1 %=(total available hours per month for level1 - sum(demo) / total available hours per month for level1
formula level2 %=(total available hours per month for level2 - sum(demo) / total available hours per month for level2
Note: Except Sundays only 6days in a week so I used a flag [Is Week End]<>1 for formula 2
- Tags:
- set analysis issue
- Mark as New
- Bookmark
- Subscribe
- Mute
- Subscribe to RSS Feed
- Permalink
- Report Inappropriate Content
Not sure if understood right. I guess you can try including the flag in all the aggregation functions like:
Count({<[Is Week End]={0},[Support Tier Level]={'Tier 1'}>} Month)
- Mark as New
- Bookmark
- Subscribe
- Mute
- Subscribe to RSS Feed
- Permalink
- Report Inappropriate Content
Not completely sure what the issue is and where exactly are you trying implement the logic? Can you point us (in your qvw) to the location where this formula is getting used?
Best,
Sunny
- Mark as New
- Bookmark
- Subscribe
- Mute
- Subscribe to RSS Feed
- Permalink
- Report Inappropriate Content
Hi sunny,
I am using it in the Pivot table as well as in the gauge chart
formula for finding 1 application availability for Jan example
step1: 24hrs * 31 days for the month=744*COUNT OF TIER1 APPLICATIONS
step2: 24hrs * 31 days for the month=744*COUNT OF TIER1 APPLICATIONS-sum([Client Impact Duration]
step3: 24hrs * 31 days for the month=744*COUNT OF TIER1 APPLICATIONS-sum([Client Impact Duration] / 24hrs * 31 days for the month=744*COUNT OF TIER1 APPLICATIONS
Same for the Tier 2 Applications But it is 16Hrs based and except Sunday
- Mark as New
- Bookmark
- Subscribe
- Mute
- Subscribe to RSS Feed
- Permalink
- Report Inappropriate Content
Can you check the numbers now to check if the number make sense now 
- Mark as New
- Bookmark
- Subscribe
- Mute
- Subscribe to RSS Feed
- Permalink
- Report Inappropriate Content
Hi Sunny,
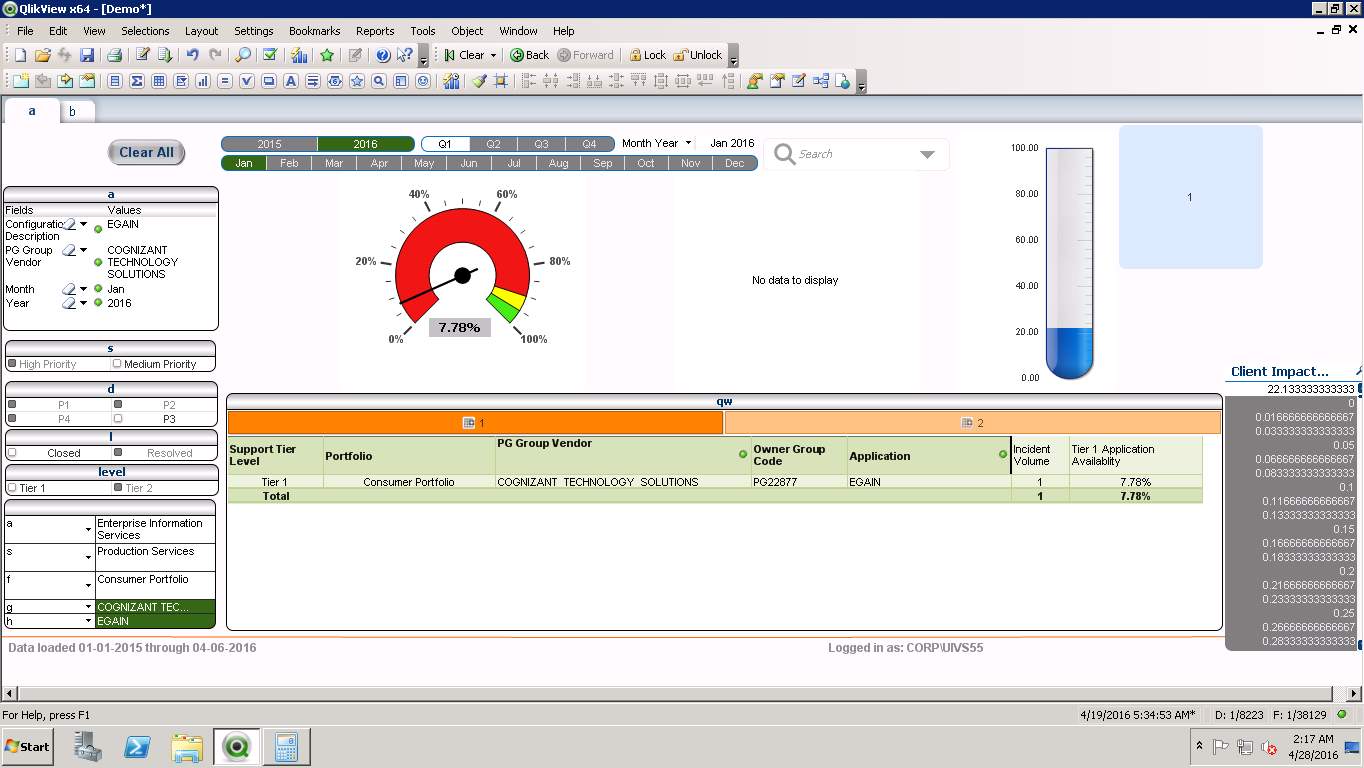
Thanks for the reply , when we select for single application the availability should be 97.02%, I have taken a screen shot and attached but its showing 7.78% and I have attached excel sheet how the calculations done
- Mark as New
- Bookmark
- Subscribe
- Mute
- Subscribe to RSS Feed
- Permalink
- Report Inappropriate Content
What is cid in your Sum(cid) in excel?
- Mark as New
- Bookmark
- Subscribe
- Mute
- Subscribe to RSS Feed
- Permalink
- Report Inappropriate Content
Hi treseco,
cid= client impact duration