Unlock a world of possibilities! Login now and discover the exclusive benefits awaiting you.
- Qlik Community
- :
- Forums
- :
- Analytics
- :
- New to Qlik Analytics
- :
- Re: KPI Referecing Alerting
- Subscribe to RSS Feed
- Mark Topic as New
- Mark Topic as Read
- Float this Topic for Current User
- Bookmark
- Subscribe
- Mute
- Printer Friendly Page
- Mark as New
- Bookmark
- Subscribe
- Mute
- Subscribe to RSS Feed
- Permalink
- Report Inappropriate Content
KPI Referecing Alerting
Hello All,
I am new to Qlik Sense and I would like to know if the following objective is a possibility within Qlik Sense. The objective in a telecommunication environment:
Data would be sent through on an hourly basis and we would like to check if the following:
- When there is a reference value (i.e. Average Call Duration is 6 mins) for a destination then this would be alerted visually.
- The above point would need to be across a set of variables (i.e Service Level or Product Level, Answer Seizure Ratio,etc)
- The data would be set up to be held for 24 hours at any one given time.
- Data update would need to be updated automatically.
How can the above be achieved.
Appreciate any feedback.
Thanks
Shankar
- Mark as New
- Bookmark
- Subscribe
- Mute
- Subscribe to RSS Feed
- Permalink
- Report Inappropriate Content
Hi Shankar,
there are answers for your objectives
1) When there is a reference value (i.e. Average Call Duration is 6 mins) for a destination then this would be alerted visually.
Yes this is possible. You can colour code the visualizations to display RAG for quick insights of the data. You can even visualize the data you have in any intuitive way you can imagine off.
2) The above point would need to be across a set of variables (i.e Service Level or Product Level, Answer Seizure Ratio,etc)
Yes this can be achieved.
3 & 4) The data would be set up to be held for 24 hours at any one given time.Data update would need to be updated automatically.
for automatic data refresh from your sources you will have to go with the enterprise version of Qliksense. The entire process can be automated.
Thanks,
Sangram Reddy.
- Mark as New
- Bookmark
- Subscribe
- Mute
- Subscribe to RSS Feed
- Permalink
- Report Inappropriate Content
Thanks Sangram.
Can I futher bother you as to understand how RAG is defined and where this can be defined, we currently have the following version of Qlik Sense: Version 2.1.1+Build:2.2.origin/release/ms13.
Best Regards
Shankar
- Mark as New
- Bookmark
- Subscribe
- Mute
- Subscribe to RSS Feed
- Permalink
- Report Inappropriate Content
It can be done using a custom colour expression.some thing like this:
if(sum(Sales) < 100000,rgb(255,0,0),if(sum(sales) > 500000,rgb(146,208,80),rgb(255,192,0)))
- Mark as New
- Bookmark
- Subscribe
- Mute
- Subscribe to RSS Feed
- Permalink
- Report Inappropriate Content
Thanks Sangram,
Where would this formula be set? (i.e. Dimension) of a chart?
Is there are many destination with variable KPI, do you know any way the above can be defined to specific destination(s)?
Also the ranking of the destination(s), can this be ordered automatically by the criteria (i.e. Minutes, No of Calls,etc).
Best Regards
Shankar
- Mark as New
- Bookmark
- Subscribe
- Mute
- Subscribe to RSS Feed
- Permalink
- Report Inappropriate Content
Hello
Can anyone help with the above query?
Regards
Shankar
- Mark as New
- Bookmark
- Subscribe
- Mute
- Subscribe to RSS Feed
- Permalink
- Report Inappropriate Content
Hi G Shankar,
if you are using a barchart , you will have to use this expression as a custom colour expression in the presentation tab in the properties panel. In a KPI you have to set it graphically using the below options:
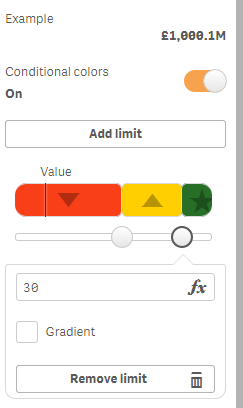
Thanks,
Sangram.
- Mark as New
- Bookmark
- Subscribe
- Mute
- Subscribe to RSS Feed
- Permalink
- Report Inappropriate Content
Thanks Sangram,
I will start with the relevant feedback I have an will update if there is any further query.
Regards
Shankar
- Mark as New
- Bookmark
- Subscribe
- Mute
- Subscribe to RSS Feed
- Permalink
- Report Inappropriate Content
Always Welcome!