Unlock a world of possibilities! Login now and discover the exclusive benefits awaiting you.
- Qlik Community
- :
- Forums
- :
- Analytics
- :
- New to Qlik Analytics
- :
- Re: Limiting bars
- Subscribe to RSS Feed
- Mark Topic as New
- Mark Topic as Read
- Float this Topic for Current User
- Bookmark
- Subscribe
- Mute
- Printer Friendly Page
- Mark as New
- Bookmark
- Subscribe
- Mute
- Subscribe to RSS Feed
- Permalink
- Report Inappropriate Content
Limiting bars
Hello Everyone,
I am trying for a solution around how to limit the bars dynamically.
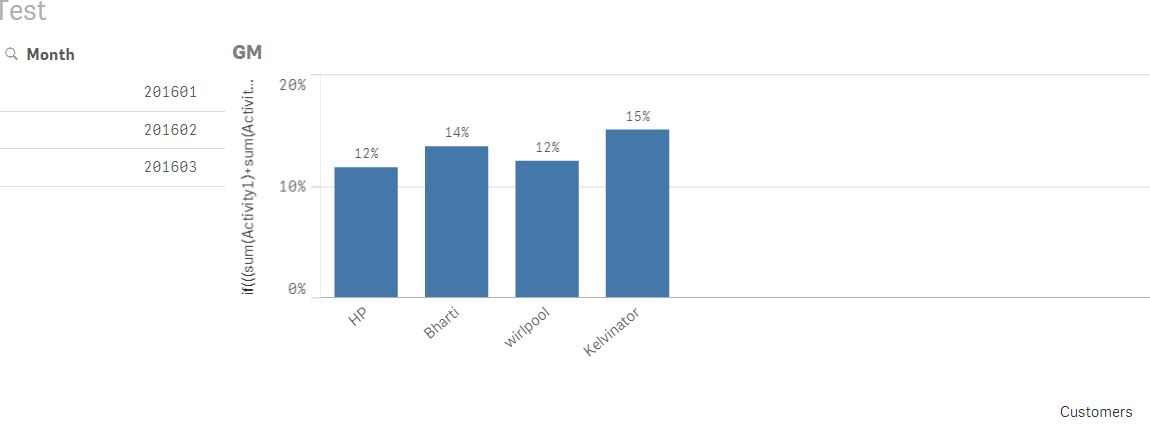
In my below bar graph, i want to limit the bars to 2 based on customers sum(Revenue) in desc order.
Dimensions - Customers
Measure -
if(((sum(Activity1)+sum(Activity2)+sum(Activity3)+sum(Pcost)+sum(Tcost))/sum(Revenue))>.1,
((sum(Activity1)+sum(Activity2)+sum(Activity3)+sum(Pcost)+sum(Tcost))/sum(Revenue)),
0)
Sorted expression - sum(Revenue) in desc order
data handling - not showing zero values.
any suggestion how to show only 2 bars for customers with sum(revenue) in desc order.
thanks, please refer the attached qvf.
- « Previous Replies
-
- 1
- 2
- Next Replies »
- Mark as New
- Bookmark
- Subscribe
- Mute
- Subscribe to RSS Feed
- Permalink
- Report Inappropriate Content
Hi,
thanks, this solution is working fine. but when i use this in qlik sense server with huge no customer,
i got the results in different way. i dont get the exactly top 20 customer.
when i put a number in variable chart, it varifies exactly all cusomer and show only those bars when GB is > 50% and they ordered by revenue.
Please refer the attached image. where i put 200 in variable and it gave 19 customers only.
Regards,
Prasanta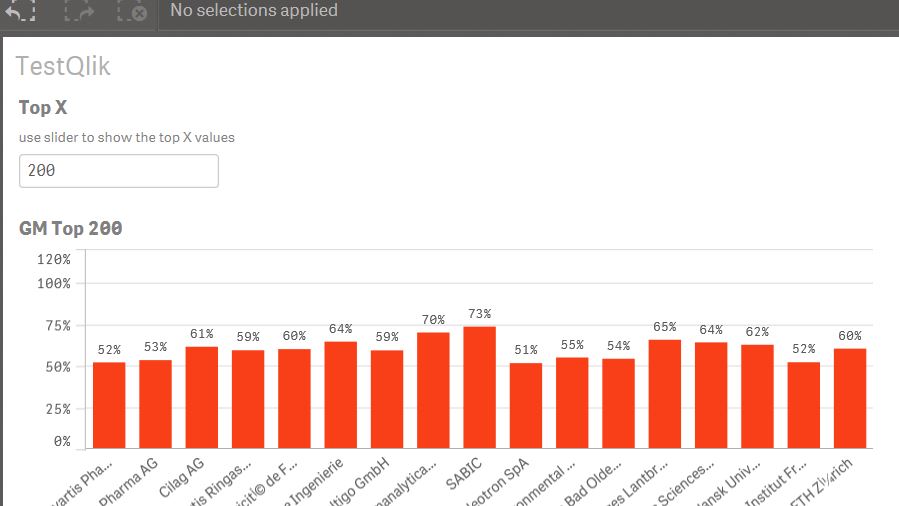
- Mark as New
- Bookmark
- Subscribe
- Mute
- Subscribe to RSS Feed
- Permalink
- Report Inappropriate Content
I'm afraid I don't understand what you want. You say you don't get a top 20, but 19 values. And you seem to expect 200. I don't get it. A top 20 can't have 200 values as far as I understand this universe. And I'm afraid your screenshot does not explain much about your document except that it's possible to show some bars with percentages on top.
talk is cheap, supply exceeds demand
- Mark as New
- Bookmark
- Subscribe
- Mute
- Subscribe to RSS Feed
- Permalink
- Report Inappropriate Content
hi,
May be i am not clear with the information provide to you by me.
I want top 20 customer with GB>50% and ordered by sum(Revenue).
when i user qsvariable, and entered 20, i get only 3 customers satisfying the above conditions.
thats why i tried with different nos and finaly when entered 200 in variable box, i got around 19 bars in my bar chart.
Please refer the below screen shot.
Alos please let me know if we connect over phone or webex for a discussion. that will be really helpful.
thanks in advnace.
Pl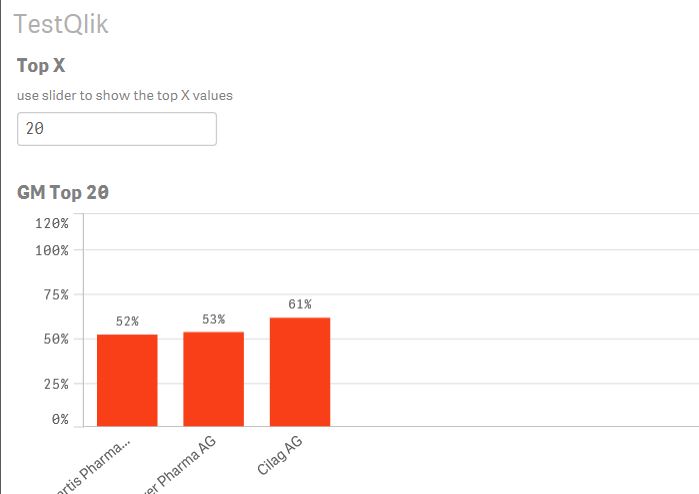
- Mark as New
- Bookmark
- Subscribe
- Mute
- Subscribe to RSS Feed
- Permalink
- Report Inappropriate Content
Can you post a qlik sense app that demonstrates the problem?
talk is cheap, supply exceeds demand
- Mark as New
- Bookmark
- Subscribe
- Mute
- Subscribe to RSS Feed
- Permalink
- Report Inappropriate Content
actually i cant share this app, thats why i created this sample app which i already have shared initially.
if its possible, can we have a webex or phone discussion?
- Mark as New
- Bookmark
- Subscribe
- Mute
- Subscribe to RSS Feed
- Permalink
- Report Inappropriate Content
Sorry, but that's not possible.
talk is cheap, supply exceeds demand
- Mark as New
- Bookmark
- Subscribe
- Mute
- Subscribe to RSS Feed
- Permalink
- Report Inappropriate Content
thanks, please let me know when you get some time.
Prasanta
- « Previous Replies
-
- 1
- 2
- Next Replies »